| Map | Pie | Office | Total | D | R | I | Margin | %Margin | Dem | Rep | Ind | Oth. | Dem | Rep | Ind | Other | | | | | | | | | | | | | | | | | | |
|---|
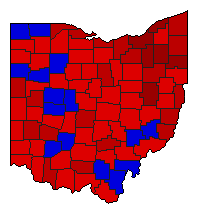
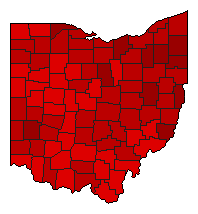 |  | Senator |
2,987,950 |
1 |
2 |
3 |
1,012,537 |
33.89% |
64.62% |
30.73% |
2.57% |
2.08% |
1,930,670 |
918,133 |
76,882 |
62,265 |
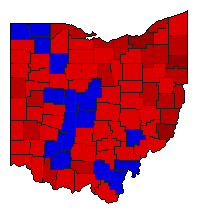
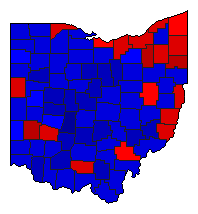 |  | Governor |
3,072,010 |
2 |
1 |
3 |
11,488 |
0.37% |
48.25% |
48.62% |
3.11% |
0.02% |
1,482,191 |
1,493,679 |
95,625 |
515 |
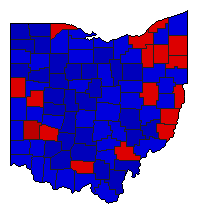
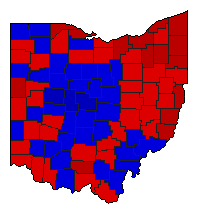
 |  | Lt. Governor |
2,920,756 |
1 |
2 |
3 |
217,297 |
7.44% |
51.82% |
44.38% |
3.79% |
0.00% |
1,513,619 |
1,296,322 |
110,776 |
39 |
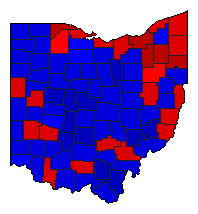
 |  | Secretary of State |
2,806,379 |
2 |
1 |
0 |
119,173 |
4.25% |
47.88% |
52.12% |
0.00% |
0.00% |
1,343,603 |
1,462,776 |
0 |
0 |
 |  | State Treasurer |
2,784,256 |
1 |
2 |
0 |
732,862 |
26.32% |
63.16% |
36.84% |
0.00% |
0.00% |
1,758,559 |
1,025,697 |
0 |
0 |
 |  | Attorney General |
2,786,479 |
1 |
2 |
0 |
505,367 |
18.14% |
59.07% |
40.93% |
0.00% |
0.00% |
1,645,923 |
1,140,556 |
0 |
0 |
 |  | State Auditor |
2,804,168 |
1 |
2 |
0 |
319,250 |
11.38% |
55.69% |
44.31% |
0.00% |
0.00% |
1,561,709 |
1,242,459 |
0 |
0 |
|
