| Map | Pie | Office | Total | D | R | I | Margin | %Margin | Dem | Rep | Ind | Oth. | Dem | Rep | Ind | Other | | | | | | | | | | | | | | | | | | |
|---|
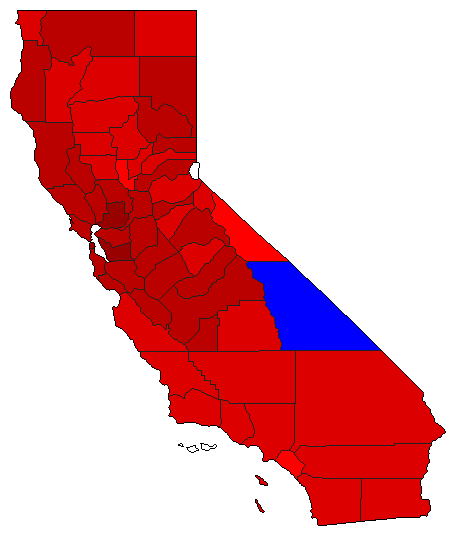 | | Senator |
6,102,432 |
1 |
2 |
0 |
1,482,893 |
24.30% |
60.52% |
36.22% |
0.00% |
3.26% |
3,693,160 |
2,210,267 |
0 |
199,005 |
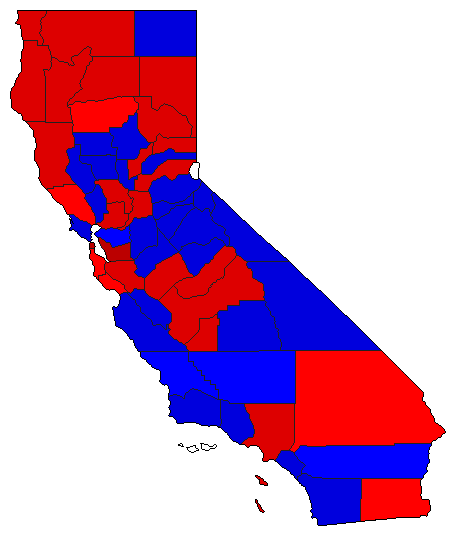 | | Governor |
6,248,070 |
1 |
2 |
0 |
178,694 |
2.86% |
50.12% |
47.26% |
0.00% |
2.62% |
3,131,648 |
2,952,954 |
0 |
163,468 |
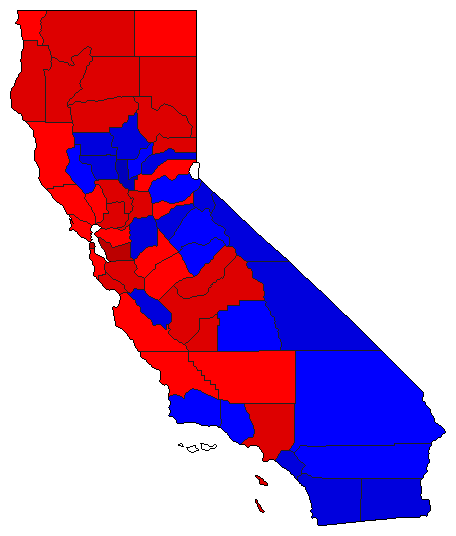 |  | Lt. Governor |
6,070,736 |
1 |
2 |
0 |
173,901 |
2.86% |
49.20% |
46.33% |
0.00% |
4.47% |
2,986,537 |
2,812,636 |
0 |
271,563 |
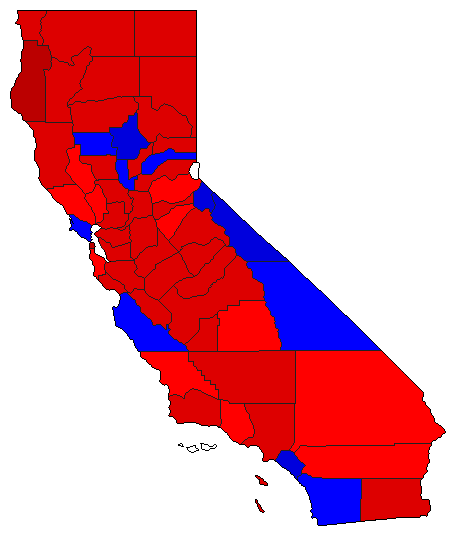
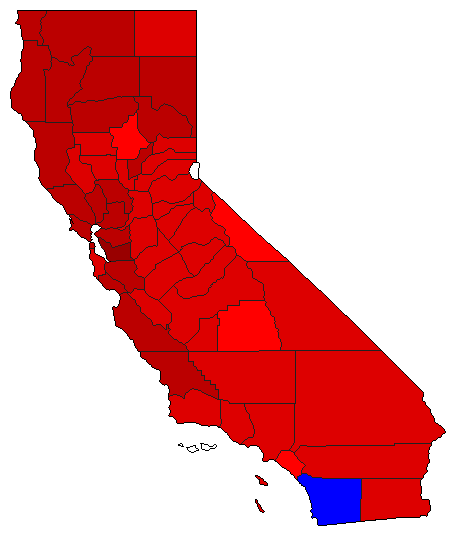 |  | Secretary of State |
6,026,594 |
1 |
2 |
0 |
1,291,776 |
21.43% |
57.93% |
36.50% |
0.00% |
5.57% |
3,491,292 |
2,199,516 |
0 |
335,786 |
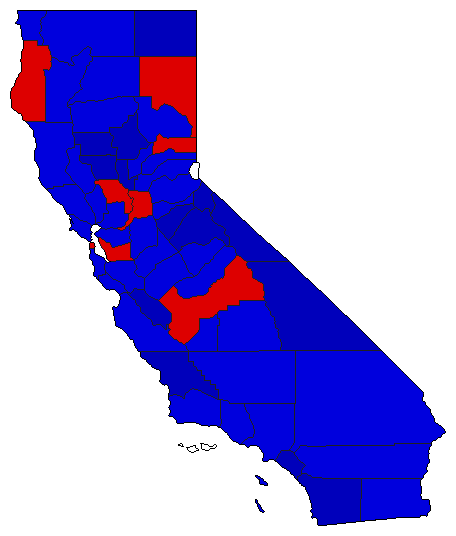
 |  | State Treasurer |
5,988,970 |
1 |
2 |
0 |
578,709 |
9.66% |
52.50% |
42.84% |
0.00% |
4.67% |
3,144,124 |
2,565,415 |
0 |
279,431 |
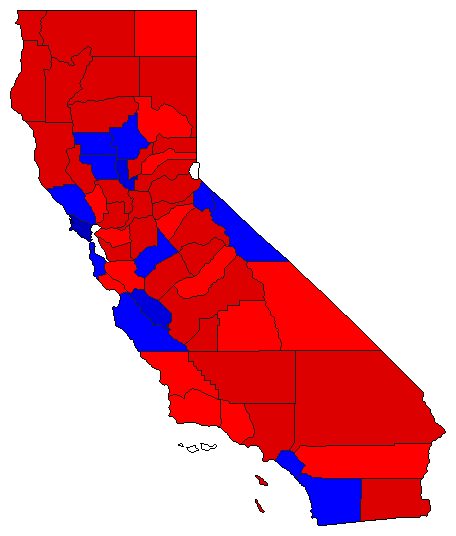
 |  | Attorney General |
6,020,123 |
2 |
1 |
0 |
604,127 |
10.04% |
44.98% |
55.02% |
0.00% |
0.00% |
2,707,998 |
3,312,125 |
0 |
0 |
 |  | Controller |
5,933,183 |
1 |
2 |
0 |
318,427 |
5.37% |
49.59% |
44.23% |
0.00% |
6.18% |
2,942,512 |
2,624,085 |
0 |
366,586 |
|


