1976 General Election Results Comparison - Hawaii
| Map | Pie | Office | Total | D | R | I | Margin | %Margin | Dem | Rep | Ind | Oth. | Dem | Rep | Ind | Other |
 |  | President | 291,301 | 1 | 2 | - | 7,372 | 2.53% | 50.59% | 48.06% | 0.00% | 1.35% | 147,375 | 140,003 | 0 | 3,923 |
 |  | Senator | 302,092 | 1 | 2 | 3 | 39,581 | 13.10% | 53.73% | 40.62% | 4.71% | 0.94% | 162,305 | 122,724 | 14,226 | 2,837 |
 |  | Governor | 302,092 | 1 | 2 | 3 | 39,581 | 13.10% | 53.73% | 40.62% | 4.71% | 0.94% | 162,305 | 122,724 | 14,226 | 2,837 |
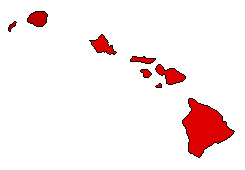
Hawaii Results for 1976
Login
© Dave Leip's Atlas of U.S. Elections, LLC 2019 All Rights Reserved
Note: The advertisement links below may advocate political positions that this site does not endorse.
Login
© Dave Leip's Atlas of U.S. Elections, LLC 2019 All Rights Reserved
Note: The advertisement links below may advocate political positions that this site does not endorse.