1976 General Election Results Comparison - Illinois
| Map | Pie | Office | Total | D | R | I | Margin | %Margin | Dem | Rep | Ind | Oth. | Dem | Rep | Ind | Other |
 |  | President | 4,718,833 | 2 | 1 | - | 92,974 | 1.97% | 48.13% | 50.10% | 0.00% | 1.76% | 2,271,295 | 2,364,269 | 0 | 83,269 |
 | Governor | 4,639,040 | 2 | 1 | 0 | 1,390,137 | 29.97% | 34.71% | 64.68% | 0.00% | 0.61% | 1,610,258 | 3,000,395 | 0 | 28,387 | |
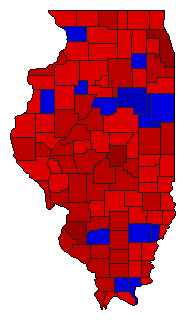 |  | Secretary of State | 4,502,545 | 1 | 2 | 0 | 1,344,283 | 29.86% | 64.55% | 34.69% | 0.00% | 0.76% | 2,906,311 | 1,562,028 | 0 | 34,206 |
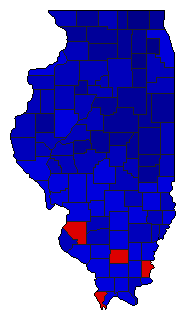 | Attorney General | 4,511,768 | 2 | 1 | 0 | 1,116,213 | 24.74% | 37.21% | 61.95% | 0.00% | 0.84% | 1,678,800 | 2,795,013 | 0 | 37,955 | |
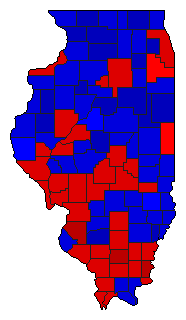 |  | Comptroller General | 4,455,624 | 1 | 2 | 0 | 180,097 | 4.04% | 51.58% | 47.53% | 0.00% | 0.89% | 2,298,074 | 2,117,977 | 0 | 39,573 |
Illinois Results for 1976
Login
© Dave Leip's Atlas of U.S. Elections, LLC 2019 All Rights Reserved
Note: The advertisement links below may advocate political positions that this site does not endorse.
Login
© Dave Leip's Atlas of U.S. Elections, LLC 2019 All Rights Reserved
Note: The advertisement links below may advocate political positions that this site does not endorse.