| Map | Pie | Office | Total | D | R | I | Margin | %Margin | Dem | Rep | Ind | Oth. | Dem | Rep | Ind | Other | | | | | | | | | | | | | | | | | | |
|---|
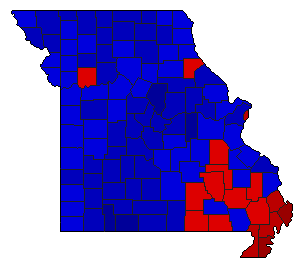
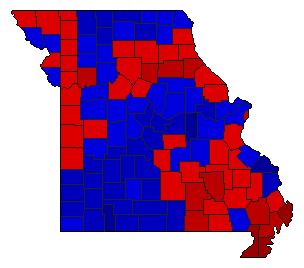
 |  | President |
1,953,600 |
1 |
2 |
- |
70,944 |
3.63% |
51.10% |
47.47% |
0.00% |
1.42% |
998,387 |
927,443 |
0 |
27,770 |
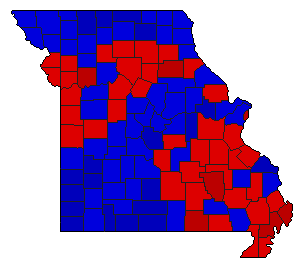
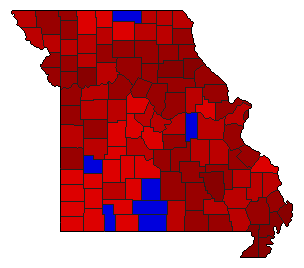
 | | Senator |
1,914,460 |
2 |
1 |
0 |
276,496 |
14.44% |
42.50% |
56.94% |
0.00% |
0.57% |
813,571 |
1,090,067 |
0 |
10,822 |
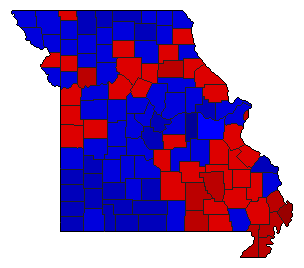
 | | Governor |
1,933,509 |
1 |
2 |
0 |
13,074 |
0.68% |
50.23% |
49.55% |
0.00% |
0.22% |
971,184 |
958,110 |
0 |
4,215 |
 | | Lt. Governor |
1,893,946 |
2 |
1 |
0 |
10,363 |
0.55% |
49.45% |
50.00% |
0.00% |
0.56% |
936,527 |
946,890 |
0 |
10,529 |
 | | Secretary of State |
1,874,469 |
1 |
2 |
0 |
687,161 |
36.66% |
67.91% |
31.25% |
0.00% |
0.83% |
1,273,023 |
585,862 |
0 |
15,584 |
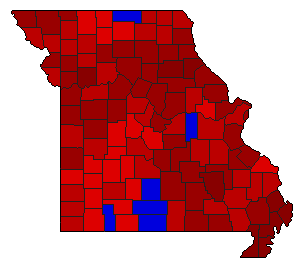
 | | State Treasurer |
1,872,337 |
1 |
2 |
0 |
730,929 |
39.04% |
69.52% |
30.48% |
0.00% |
0.00% |
1,301,633 |
570,704 |
0 |
0 |
 | | Attorney General |
1,877,945 |
2 |
1 |
0 |
45,619 |
2.43% |
48.79% |
51.21% |
0.00% |
0.00% |
916,163 |
961,782 |
0 |
0 |
|
