1976 General Election Results Comparison - North Carolina
| Map | Pie | Office | Total | D | R | I | Margin | %Margin | Dem | Rep | Ind | Oth. | Dem | Rep | Ind | Other |
 |  | President | 1,677,906 | 1 | 2 | - | 185,405 | 11.05% | 55.27% | 44.22% | 0.00% | 0.51% | 927,365 | 741,960 | 0 | 8,581 |
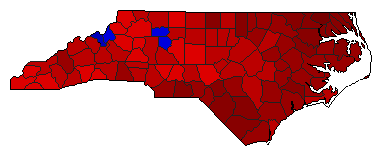 | Governor | 1,663,762 | 1 | 2 | 3 | 517,192 | 31.09% | 64.99% | 33.91% | 0.82% | 0.29% | 1,081,293 | 564,101 | 13,604 | 4,764 |
North Carolina Results for 1976
Login
© Dave Leip's Atlas of U.S. Elections, LLC 2019 All Rights Reserved
Note: The advertisement links below may advocate political positions that this site does not endorse.
Login
© Dave Leip's Atlas of U.S. Elections, LLC 2019 All Rights Reserved
Note: The advertisement links below may advocate political positions that this site does not endorse.