Note: The Google advertisement links below may advocate political positions that this site does not endorse.
| Map | Pie | Office | Total | D | R | I | Margin | %Margin | Dem | Rep | Ind | Oth. | Dem | Rep | Ind | Other | | | | | | | | | | | | | | | | | | |
|---|
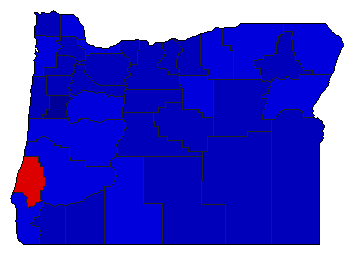
 |  | President |
1,029,876 |
2 |
1 |
- |
1,713 |
0.17% |
47.62% |
47.78% |
0.00% |
4.60% |
490,407 |
492,120 |
0 |
47,349 |
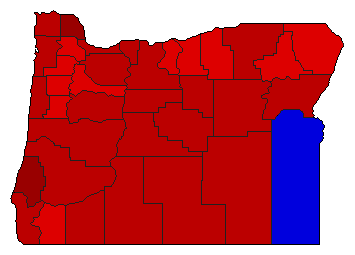
 |  | Secretary of State |
980,782 |
2 |
1 |
0 |
203,242 |
20.72% |
39.62% |
60.34% |
0.00% |
0.04% |
388,565 |
591,807 |
0 |
410 |
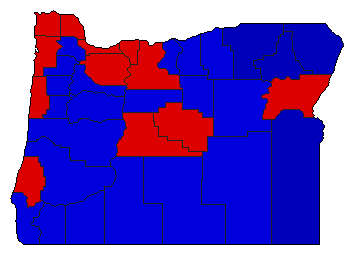 |  | State Treasurer |
972,425 |
2 |
1 |
0 |
15,152 |
1.56% |
49.22% |
50.77% |
0.00% |
0.01% |
478,593 |
493,745 |
0 |
87 |
 |  | Attorney General |
950,531 |
1 |
2 |
0 |
249,336 |
26.23% |
63.10% |
36.87% |
0.00% |
0.03% |
599,796 |
350,460 |
0 |
275 |
|
