| Map | Pie | Office | Total | D | R | I | Margin | %Margin | Dem | Rep | Ind | Oth. | Dem | Rep | Ind | Other | | | | | | | | | | | | | | | | | | |
|---|
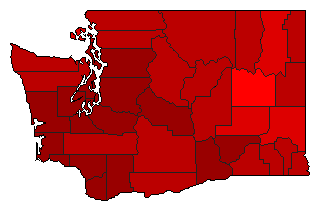
 |  | President |
1,555,534 |
2 |
1 |
- |
60,409 |
3.88% |
46.11% |
50.00% |
0.00% |
3.89% |
717,323 |
777,732 |
0 |
60,479 |
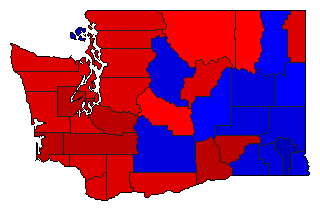
 | | Senator |
1,491,111 |
1 |
2 |
3 |
709,673 |
47.59% |
71.84% |
24.25% |
1.89% |
2.02% |
1,071,219 |
361,546 |
28,182 |
30,164 |
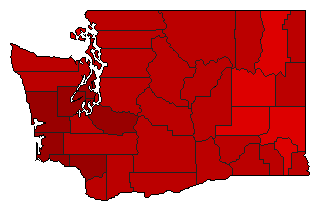
 | | Governor |
1,549,082 |
1 |
2 |
0 |
132,058 |
8.52% |
53.05% |
44.53% |
0.00% |
2.42% |
821,797 |
689,739 |
0 |
37,546 |
 | | Lt. Governor |
1,460,801 |
1 |
2 |
0 |
580,936 |
39.77% |
67.32% |
27.55% |
0.00% |
5.13% |
983,395 |
402,459 |
0 |
74,947 |
 | | Secretary of State |
1,438,099 |
2 |
1 |
0 |
263,296 |
18.31% |
39.09% |
57.39% |
0.00% |
3.52% |
562,092 |
825,388 |
0 |
50,619 |
 | | State Treasurer |
1,399,673 |
1 |
2 |
0 |
634,052 |
45.30% |
71.18% |
25.88% |
0.00% |
2.95% |
996,219 |
362,167 |
0 |
41,287 |
 | | Attorney General |
1,449,062 |
2 |
1 |
0 |
225,607 |
15.57% |
40.89% |
56.46% |
0.00% |
2.66% |
592,477 |
818,084 |
0 |
38,501 |
 |  | Comptroller General |
1,397,086 |
1 |
2 |
3 |
607,301 |
43.47% |
70.09% |
26.63% |
3.28% |
0.00% |
979,286 |
371,985 |
45,815 |
0 |
 | | State Auditor |
1,361,055 |
1 |
2 |
0 |
555,322 |
40.80% |
68.73% |
27.93% |
0.00% |
3.35% |
935,402 |
380,080 |
0 |
45,573 |
 | | Insurance Commissioner |
1,416,180 |
2 |
1 |
0 |
139,032 |
9.82% |
43.44% |
53.25% |
0.00% |
3.31% |
615,118 |
754,150 |
0 |
46,912 |
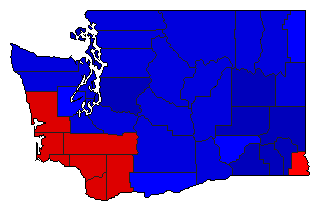
| | | Map | Pie | Initiative | Total Vote | N | | Y | Margin | %Margin | No | | Yes | Oth. | No | | Yes | |
 | | Initiative |
1,383,002 |
2 |
0 |
1 |
543,616 |
39.31% |
30.35% |
0.00% |
69.65% |
0.00% |
419,693 |
0 |
963,309 |
0 |
 | | Initiative |
1,340,560 |
1 |
0 |
2 |
400,702 |
29.89% |
64.95% |
0.00% |
35.05% |
0.00% |
870,631 |
0 |
469,929 |
0 |
 | | Initiative |
1,446,709 |
1 |
0 |
2 |
480,803 |
33.23% |
66.62% |
0.00% |
33.38% |
0.00% |
963,756 |
0 |
482,953 |
0 |
|
