1976 General Election Results Comparison - West Virginia
| Map | Pie | Office | Total | D | R | I | Margin | %Margin | Dem | Rep | Ind | Oth. | Dem | Rep | Ind | Other |
 |  | President | 750,674 | 1 | 2 | - | 121,154 | 16.14% | 58.07% | 41.93% | 0.00% | 0.00% | 435,914 | 314,760 | 0 | 0 |
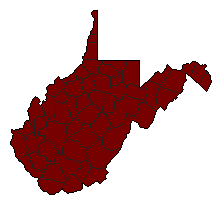 | Senator | 566,423 | 1 | 0 | 0 | 566,423 | 100.00% | 100.00% | 0.00% | 0.00% | 0.00% | 566,423 | 0 | 0 | 0 | |
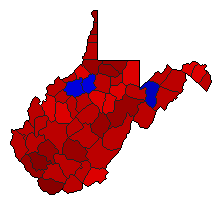 | Governor | 749,081 | 1 | 2 | 0 | 242,241 | 32.34% | 66.17% | 33.83% | 0.00% | 0.00% | 495,661 | 253,420 | 0 | 0 |
West Virginia Results for 1976
Login
© Dave Leip's Atlas of U.S. Elections, LLC 2019 All Rights Reserved
Note: The advertisement links below may advocate political positions that this site does not endorse.
Login
© Dave Leip's Atlas of U.S. Elections, LLC 2019 All Rights Reserved
Note: The advertisement links below may advocate political positions that this site does not endorse.