| Map | Pie | Office | Total | D | R | I | Margin | %Margin | Dem | Rep | Ind | Oth. | Dem | Rep | Ind | Other | | | | | | | | | | | | | | | | | | |
|---|
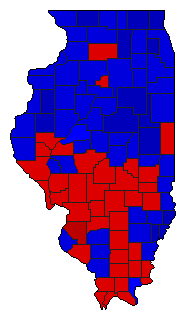 | | Senator |
3,184,764 |
2 |
1 |
4 |
250,524 |
7.87% |
45.47% |
53.34% |
0.50% |
0.69% |
1,448,187 |
1,698,711 |
15,922 |
21,944 |
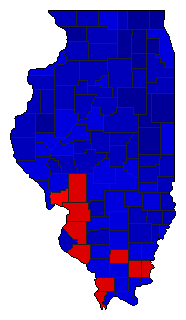 | | Governor |
3,150,107 |
2 |
1 |
0 |
596,550 |
18.94% |
40.10% |
59.04% |
0.00% |
0.87% |
1,263,134 |
1,859,684 |
0 |
27,289 |
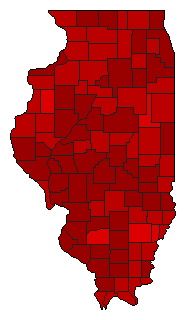 |  | Secretary of State |
3,135,527 |
1 |
2 |
0 |
1,516,986 |
48.38% |
73.82% |
25.44% |
0.00% |
0.75% |
2,314,546 |
797,560 |
0 |
23,421 |
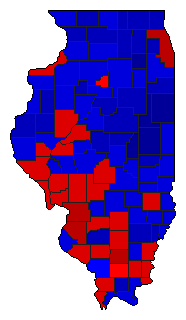 |  | State Treasurer |
2,981,182 |
1 |
2 |
0 |
164,639 |
5.52% |
51.95% |
46.42% |
0.00% |
1.63% |
1,548,605 |
1,383,966 |
0 |
48,611 |
 |  | Attorney General |
3,070,031 |
2 |
1 |
0 |
939,673 |
30.61% |
34.20% |
64.81% |
0.00% |
0.98% |
1,050,085 |
1,989,758 |
0 |
30,188 |
 |  | Comptroller General |
2,985,988 |
1 |
2 |
0 |
153,934 |
5.16% |
51.67% |
46.52% |
0.00% |
1.81% |
1,542,983 |
1,389,049 |
0 |
53,956 |
|
