1978 General Election Results Comparison - Kansas
| Map | Pie | Office | Total | D | R | I | Margin | %Margin | Dem | Rep | Ind | Oth. | Dem | Rep | Ind | Other |
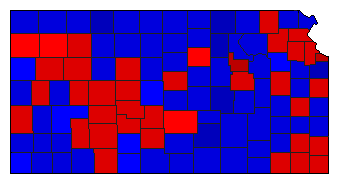
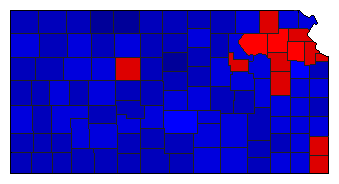 |  | Senator | 748,818 | 2 | 1 | 0 | 85,743 | 11.45% | 42.41% | 53.87% | 0.00% | 3.72% | 317,611 | 403,354 | 0 | 27,853 |
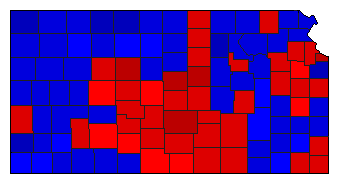 |  | Governor | 736,246 | 1 | 2 | 0 | 15,820 | 2.15% | 49.42% | 47.27% | 0.00% | 3.31% | 363,835 | 348,015 | 0 | 24,396 |
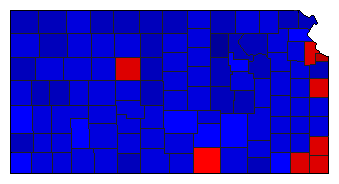 |  | Secretary of State | 678,426 | 2 | 1 | 0 | 68,058 | 10.03% | 43.18% | 53.21% | 0.00% | 3.61% | 292,935 | 360,993 | 0 | 24,498 |
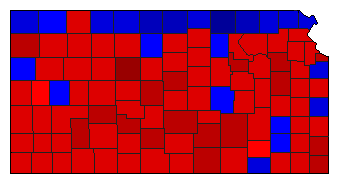 |  | State Treasurer | 691,029 | 1 | 2 | 0 | 115,300 | 16.69% | 56.83% | 40.15% | 0.00% | 3.02% | 392,739 | 277,439 | 0 | 20,851 |
 |  | Attorney General | 729,602 | 2 | 1 | 0 | 61,388 | 8.41% | 44.96% | 53.37% | 0.00% | 1.67% | 328,010 | 389,398 | 0 | 12,194 |
 |  | Insurance Commissioner | 641,496 | 0 | 1 | 0 | 468,682 | 73.06% | 0.00% | 86.53% | 0.00% | 13.47% | 0 | 555,089 | 0 | 86,407 |
Kansas Results for 1978
Login
© Dave Leip's Atlas of U.S. Elections, LLC 2019 All Rights Reserved
Note: The advertisement links below may advocate political positions that this site does not endorse.
Login
© Dave Leip's Atlas of U.S. Elections, LLC 2019 All Rights Reserved
Note: The advertisement links below may advocate political positions that this site does not endorse.