1978 General Election Results Comparison - Massachusetts
| Map | Pie | Office | Total | D | R | I | Margin | %Margin | Dem | Rep | Ind | Oth. | Dem | Rep | Ind | Other |
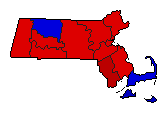 | Senator | 1,985,700 | 1 | 2 | 0 | 202,699 | 10.21% | 55.06% | 44.85% | 0.00% | 0.09% | 1,093,283 | 890,584 | 0 | 1,833 | |
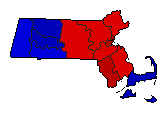 | Governor | 1,962,251 | 1 | 2 | 3 | 104,222 | 5.31% | 52.51% | 47.19% | 0.30% | 0.00% | 1,030,294 | 926,072 | 5,885 | 0 | |
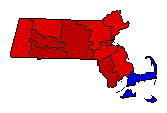 | Secretary of State | 1,860,066 | 1 | 2 | 0 | 370,921 | 19.94% | 59.97% | 40.02% | 0.00% | 0.01% | 1,115,409 | 744,488 | 0 | 169 | |
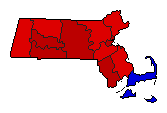 | State Treasurer | 1,869,258 | 1 | 2 | 0 | 382,729 | 20.47% | 60.24% | 39.76% | 0.00% | 0.00% | 1,125,960 | 743,231 | 0 | 67 | |
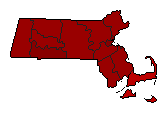 | Attorney General | 1,954,316 | 1 | 2 | 0 | 1,111,418 | 56.87% | 78.43% | 21.56% | 0.00% | 0.00% | 1,532,835 | 421,417 | 0 | 64 | |
 | State Auditor | 1,832,706 | 1 | 2 | 0 | 546,466 | 29.82% | 64.91% | 35.09% | 0.00% | 0.00% | 1,189,562 | 643,096 | 0 | 48 | |
| Map | Pie | Initiative | Total Vote | N | Y | Margin | %Margin | No | Yes | Oth. | No | Yes | ||||
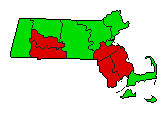 | Referendum | 1,577,063 | 2 | 0 | 1 | 47,463 | 3.01% | 48.50% | 0.00% | 51.50% | 0.00% | 764,800 | 0 | 812,263 | 0 | |
Massachusetts Results for 1978
Login
© Dave Leip's Atlas of U.S. Elections, LLC 2019 All Rights Reserved
Note: The advertisement links below may advocate political positions that this site does not endorse.
Login
© Dave Leip's Atlas of U.S. Elections, LLC 2019 All Rights Reserved
Note: The advertisement links below may advocate political positions that this site does not endorse.