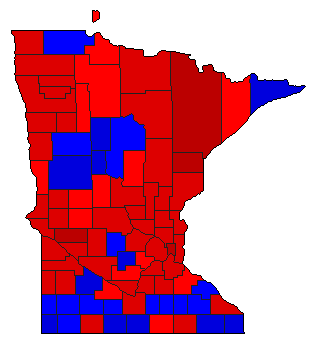
1978 General Election Results Comparison - Minnesota
| Map | Pie | Office | Total | D | R | I | Margin | %Margin | Dem | Rep | Ind | Oth. | Dem | Rep | Ind | Other |
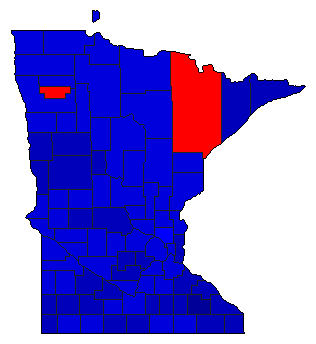 | Senator | 1,580,550 | 2 | 1 | 3 | 255,717 | 16.18% | 40.39% | 56.57% | 1.47% | 1.57% | 638,375 | 894,092 | 23,261 | 24,822 | |
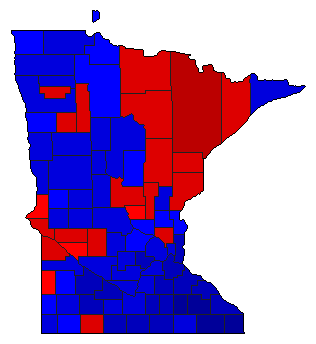 | Governor | 1,585,594 | 2 | 1 | 3 | 111,775 | 7.05% | 45.30% | 52.35% | 1.33% | 1.03% | 718,244 | 830,019 | 21,058 | 16,273 | |
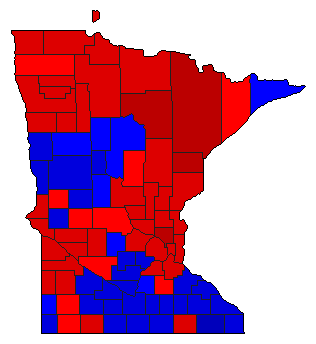 |  | Secretary of State | 1,512,123 | 1 | 2 | 0 | 123,434 | 8.16% | 52.13% | 43.97% | 0.00% | 3.90% | 788,263 | 664,829 | 0 | 59,031 |
 |  | State Treasurer | 1,501,006 | 1 | 2 | 0 | 128,087 | 8.53% | 51.43% | 42.90% | 0.00% | 5.68% | 771,955 | 643,868 | 0 | 85,183 |
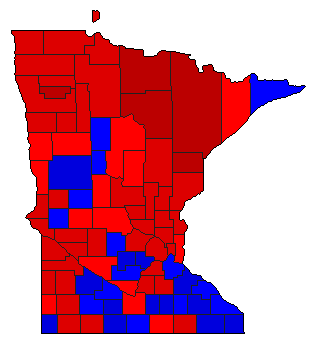
 |  | Attorney General | 1,535,230 | 1 | 2 | 0 | 239,157 | 15.58% | 55.65% | 40.07% | 0.00% | 4.28% | 854,360 | 615,203 | 0 | 65,667 |
 |  | State Auditor | 1,491,669 | 2 | 1 | 0 | 77,207 | 5.18% | 46.66% | 51.83% | 0.00% | 1.51% | 695,943 | 773,150 | 0 | 22,576 |
Minnesota Results for 1978
Login
© Dave Leip's Atlas of U.S. Elections, LLC 2019 All Rights Reserved
Note: The advertisement links below may advocate political positions that this site does not endorse.
Login
© Dave Leip's Atlas of U.S. Elections, LLC 2019 All Rights Reserved
Note: The advertisement links below may advocate political positions that this site does not endorse.