| Map | Pie | Office | Total | D | R | I | Margin | %Margin | Dem | Rep | Ind | Oth. | Dem | Rep | Ind | Other | | | | | | | | | | | | | | | | | | |
|---|
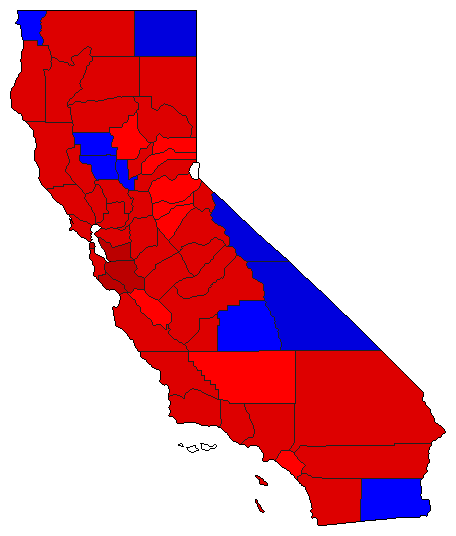 | | Governor |
6,921,273 |
1 |
2 |
3 |
1,352,278 |
19.54% |
56.04% |
36.50% |
5.46% |
1.99% |
3,878,812 |
2,526,534 |
377,960 |
137,967 |
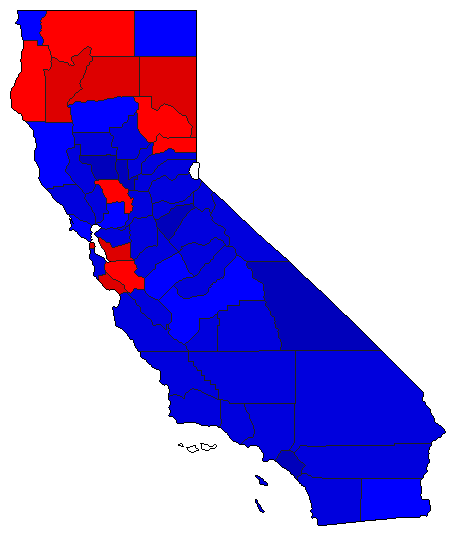 | | Lt. Governor |
6,765,572 |
2 |
1 |
0 |
565,651 |
8.36% |
43.28% |
51.64% |
0.00% |
5.07% |
2,928,329 |
3,493,980 |
0 |
343,263 |
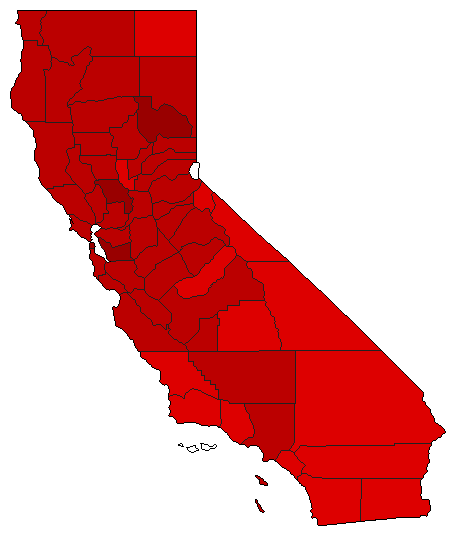 | | Secretary of State |
6,568,973 |
1 |
2 |
0 |
2,122,550 |
32.31% |
62.49% |
30.17% |
0.00% |
7.34% |
4,104,695 |
1,982,145 |
0 |
482,133 |
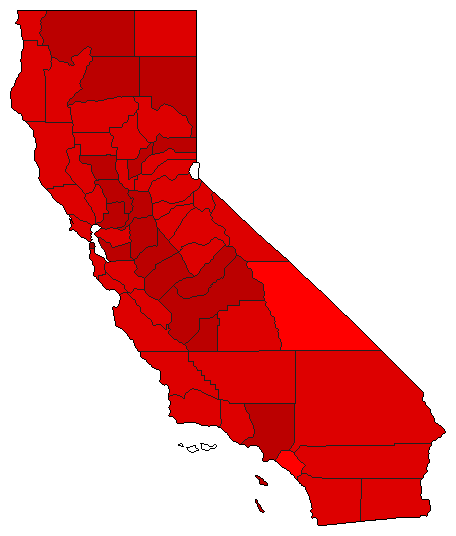 |  | State Treasurer |
6,508,549 |
1 |
2 |
0 |
1,520,958 |
23.37% |
58.69% |
35.32% |
0.00% |
6.00% |
3,819,563 |
2,298,605 |
0 |
390,381 |
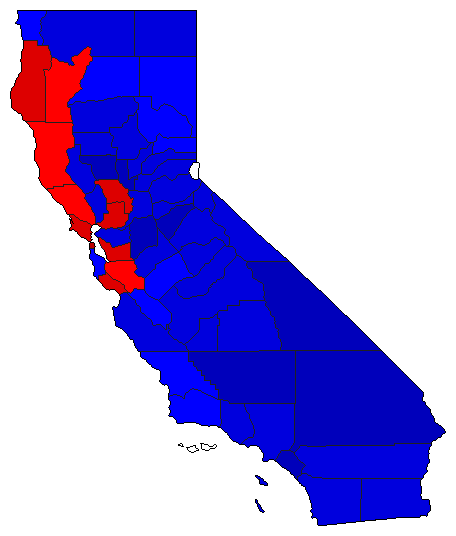 | | Attorney General |
6,728,603 |
2 |
1 |
0 |
634,897 |
9.44% |
43.45% |
52.88% |
0.00% |
3.67% |
2,923,432 |
3,558,329 |
0 |
246,842 |
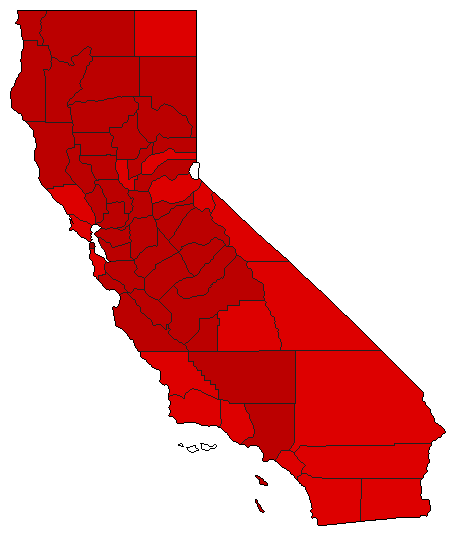 | | Controller |
6,483,388 |
1 |
2 |
0 |
1,795,932 |
27.70% |
60.49% |
32.79% |
0.00% |
6.73% |
3,921,593 |
2,125,661 |
0 |
436,134 |
| | | Map | Pie | Initiative | Total Vote | N | | Y | Margin | %Margin | No | | Yes | Oth. | No | | Yes | |
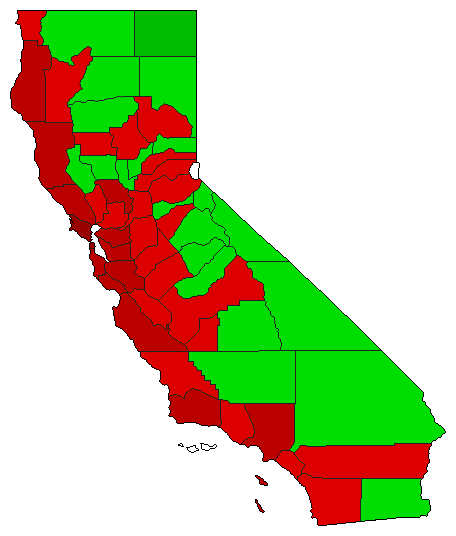 |  | Initiative |
6,792,413 |
1 |
0 |
2 |
1,145,827 |
16.87% |
58.43% |
0.00% |
41.57% |
0.00% |
3,969,120 |
0 |
2,823,293 |
0 |
|


