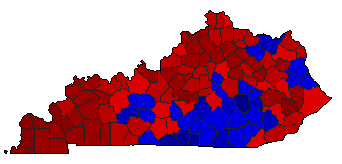
1979 General Election Results Comparison - Kentucky
| Map | Pie | Office | Total | D | R | I | Margin | %Margin | Dem | Rep | Ind | Oth. | Dem | Rep | Ind | Other |
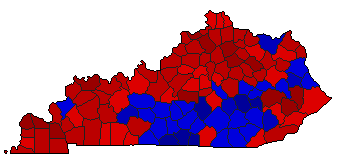 | Governor | 939,366 | 1 | 2 | 0 | 176,810 | 18.82% | 59.41% | 40.59% | 0.00% | 0.00% | 558,088 | 381,278 | 0 | 0 | |
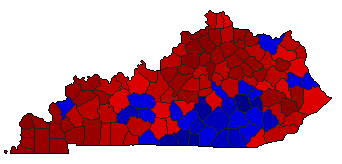 | Lt. Governor | 859,894 | 1 | 2 | 0 | 226,458 | 26.34% | 63.17% | 36.83% | 0.00% | 0.00% | 543,176 | 316,718 | 0 | 0 | |
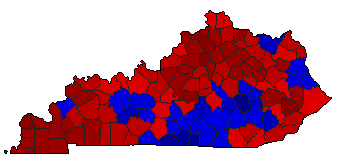 | Secretary of State | 771,643 | 1 | 2 | 0 | 182,589 | 23.66% | 61.83% | 38.17% | 0.00% | 0.00% | 477,116 | 294,527 | 0 | 0 | |
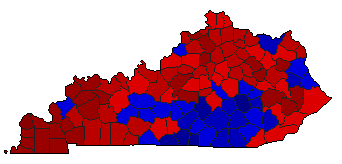
 | State Treasurer | 756,397 | 1 | 2 | 0 | 141,249 | 18.67% | 59.34% | 40.66% | 0.00% | 0.00% | 448,823 | 307,574 | 0 | 0 | |
 |  | Attorney General | 774,128 | 1 | 2 | 0 | 168,226 | 21.73% | 60.87% | 39.13% | 0.00% | 0.00% | 471,177 | 302,951 | 0 | 0 |
 | State Auditor | 771,426 | 1 | 2 | 0 | 113,820 | 14.75% | 57.38% | 42.62% | 0.00% | 0.00% | 442,623 | 328,803 | 0 | 0 | |
 | Agriculture Commissioner | 768,033 | 1 | 2 | 0 | 182,597 | 23.77% | 61.89% | 38.11% | 0.00% | 0.00% | 475,315 | 292,718 | 0 | 0 |
Kentucky Results for 1979
Login
© Dave Leip's Atlas of U.S. Elections, LLC 2019 All Rights Reserved
Note: The advertisement links below may advocate political positions that this site does not endorse.
Login
© Dave Leip's Atlas of U.S. Elections, LLC 2019 All Rights Reserved
Note: The advertisement links below may advocate political positions that this site does not endorse.