1980 General Election Results Comparison - New Hampshire
| Map | Pie | Office | Total | D | R | I | Margin | %Margin | Dem | Rep | Ind | Oth. | Dem | Rep | Ind | Other |
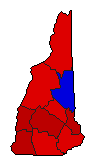
 |  | President | 383,999 | 2 | 1 | 3 | 112,841 | 29.39% | 28.35% | 57.74% | 12.94% | 0.97% | 108,864 | 221,705 | 49,693 | 3,737 |
 | Senator | 375,018 | 2 | 1 | 0 | 16,108 | 4.30% | 47.85% | 52.15% | 0.00% | 0.00% | 179,455 | 195,563 | 0 | 0 | |
 | Governor | 384,031 | 1 | 2 | 3 | 70,258 | 18.29% | 58.96% | 40.67% | 0.34% | 0.03% | 226,436 | 156,178 | 1,318 | 99 |
New Hampshire Results for 1980
Login
© Dave Leip's Atlas of U.S. Elections, LLC 2019 All Rights Reserved
Note: The advertisement links below may advocate political positions that this site does not endorse.
Login
© Dave Leip's Atlas of U.S. Elections, LLC 2019 All Rights Reserved
Note: The advertisement links below may advocate political positions that this site does not endorse.