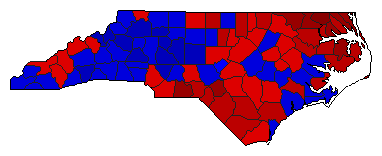
1980 General Election Results Comparison - North Carolina
| Map | Pie | Office | Total | D | R | I | Margin | %Margin | Dem | Rep | Ind | Oth. | Dem | Rep | Ind | Other |
 |  | President | 1,855,833 | 2 | 1 | 3 | 39,383 | 2.12% | 47.18% | 49.30% | 2.85% | 0.67% | 875,635 | 915,018 | 52,800 | 12,380 |
 |  | Senator | 1,797,665 | 2 | 1 | 4 | 10,411 | 0.58% | 49.38% | 49.96% | 0.24% | 0.42% | 887,653 | 898,064 | 4,346 | 7,602 |
 | Governor | 1,847,432 | 1 | 2 | 3 | 451,696 | 24.45% | 61.88% | 37.43% | 0.54% | 0.16% | 1,143,145 | 691,449 | 9,951 | 2,887 |
North Carolina Results for 1980
Login
© Dave Leip's Atlas of U.S. Elections, LLC 2019 All Rights Reserved
Note: The advertisement links below may advocate political positions that this site does not endorse.
Login
© Dave Leip's Atlas of U.S. Elections, LLC 2019 All Rights Reserved
Note: The advertisement links below may advocate political positions that this site does not endorse.