| Map | Pie | Office | Total | D | R | I | Margin | %Margin | Dem | Rep | Ind | Oth. | Dem | Rep | Ind | Other | | | | | | | | | | | | | | | | | | |
|---|
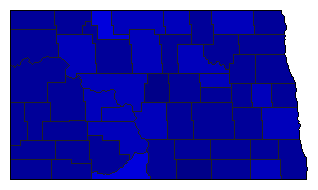
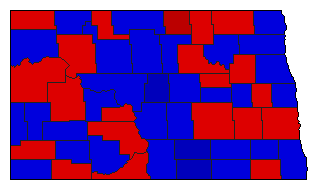
 |  | President |
301,545 |
2 |
1 |
3 |
114,506 |
37.97% |
26.26% |
64.23% |
7.84% |
1.67% |
79,189 |
193,695 |
23,640 |
5,021 |
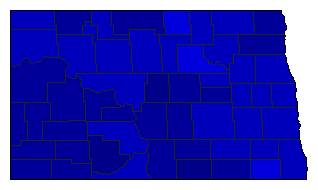
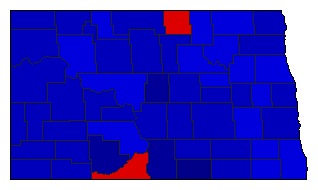
 |  | Senator |
299,272 |
2 |
1 |
0 |
123,689 |
41.33% |
28.96% |
70.29% |
0.00% |
0.76% |
86,658 |
210,347 |
0 |
2,267 |
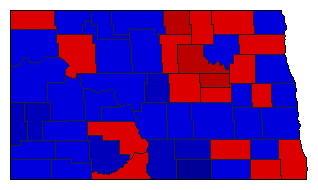
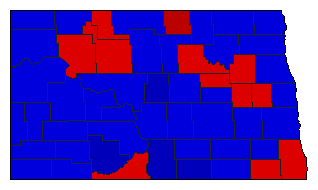 | | Governor |
302,621 |
2 |
1 |
0 |
21,839 |
7.22% |
46.39% |
53.61% |
0.00% |
0.00% |
140,391 |
162,230 |
0 |
0 |
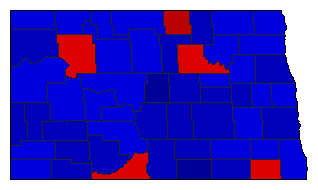
 |  | Secretary of State |
279,231 |
2 |
1 |
0 |
105,987 |
37.96% |
31.02% |
68.98% |
0.00% |
0.00% |
86,622 |
192,609 |
0 |
0 |
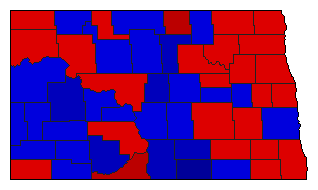 |  | State Treasurer |
274,837 |
2 |
1 |
0 |
1,791 |
0.65% |
49.67% |
50.33% |
0.00% |
0.00% |
136,523 |
138,314 |
0 |
0 |
 |  | Attorney General |
287,281 |
2 |
1 |
0 |
11,097 |
3.86% |
48.07% |
51.93% |
0.00% |
0.00% |
138,092 |
149,189 |
0 |
0 |
 |  | State Auditor |
277,641 |
2 |
1 |
0 |
65,411 |
23.56% |
38.22% |
61.78% |
0.00% |
0.00% |
106,115 |
171,526 |
0 |
0 |
 |  | Insurance Commissioner |
287,867 |
2 |
1 |
0 |
55,825 |
19.39% |
40.30% |
59.70% |
0.00% |
0.00% |
116,021 |
171,846 |
0 |
0 |
 |  | Agriculture Commissioner |
282,322 |
2 |
1 |
0 |
12,336 |
4.37% |
47.82% |
52.18% |
0.00% |
0.00% |
134,993 |
147,329 |
0 |
0 |
|
