1980 General Election Results Comparison - Oregon
| Map | Pie | Office | Total | D | R | I | Margin | %Margin | Dem | Rep | Ind | Oth. | Dem | Rep | Ind | Other |
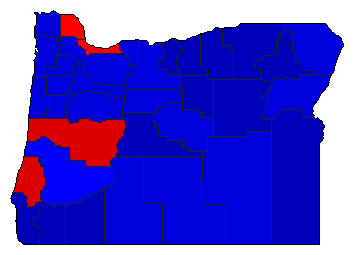
 |  | President | 1,181,516 | 2 | 1 | 3 | 114,154 | 9.66% | 38.67% | 48.33% | 9.51% | 3.49% | 456,890 | 571,044 | 112,389 | 41,193 |
 |  | Senator | 1,140,494 | 2 | 1 | 0 | 92,327 | 8.10% | 44.01% | 52.11% | 0.00% | 3.88% | 501,963 | 594,290 | 0 | 44,241 |
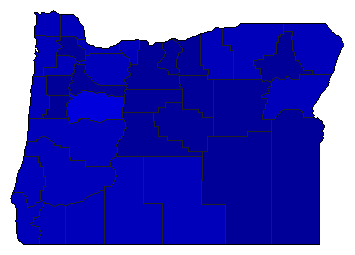 |  | Secretary of State | 1,125,509 | 2 | 1 | 0 | 462,314 | 41.08% | 27.01% | 68.09% | 0.00% | 4.90% | 304,015 | 766,329 | 0 | 55,165 |
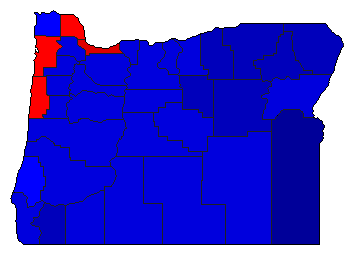 |  | State Treasurer | 1,123,196 | 2 | 1 | 0 | 111,554 | 9.93% | 42.48% | 52.41% | 0.00% | 5.11% | 477,127 | 588,681 | 0 | 57,388 |
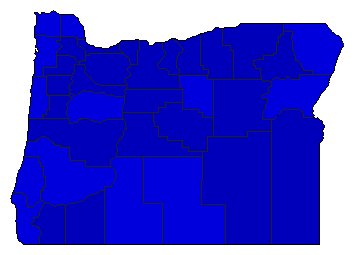 |  | Attorney General | 1,122,198 | 2 | 1 | 0 | 351,460 | 31.32% | 31.95% | 63.27% | 0.00% | 4.79% | 358,517 | 709,977 | 0 | 53,704 |
Oregon Results for 1980
Login
© Dave Leip's Atlas of U.S. Elections, LLC 2019 All Rights Reserved
Note: The advertisement links below may advocate political positions that this site does not endorse.
Login
© Dave Leip's Atlas of U.S. Elections, LLC 2019 All Rights Reserved
Note: The advertisement links below may advocate political positions that this site does not endorse.