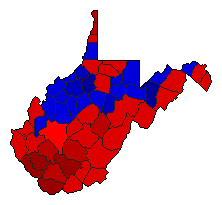
1980 General Election Results Comparison - West Virginia
| Map | Pie | Office | Total | D | R | I | Margin | %Margin | Dem | Rep | Ind | Oth. | Dem | Rep | Ind | Other |
 |  | President | 737,715 | 1 | 2 | 3 | 33,256 | 4.51% | 49.81% | 45.30% | 4.30% | 0.59% | 367,462 | 334,206 | 31,691 | 4,356 |
 | Governor | 742,150 | 1 | 2 | 0 | 64,623 | 8.71% | 54.15% | 45.44% | 0.00% | 0.41% | 401,863 | 337,240 | 0 | 3,047 | |
 | Secretary of State | 687,682 | 1 | 2 | 0 | 284,388 | 41.35% | 70.68% | 29.32% | 0.00% | 0.00% | 486,035 | 201,647 | 0 | 0 |
West Virginia Results for 1980
Login
© Dave Leip's Atlas of U.S. Elections, LLC 2019 All Rights Reserved
Note: The advertisement links below may advocate political positions that this site does not endorse.
Login
© Dave Leip's Atlas of U.S. Elections, LLC 2019 All Rights Reserved
Note: The advertisement links below may advocate political positions that this site does not endorse.