Note: The Google advertisement links below may advocate political positions that this site does not endorse.
| Map | Pie | Office | Total | D | R | I | Margin | %Margin | Dem | Rep | Ind | Oth. | Dem | Rep | Ind | Other | | | | | | | | | | | | | | | | | | |
|---|
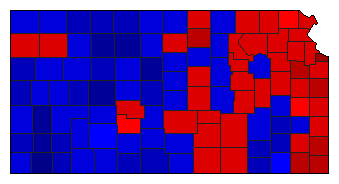 |  | Governor |
763,263 |
1 |
2 |
4 |
66,416 |
8.70% |
53.16% |
44.46% |
0.80% |
1.57% |
405,772 |
339,356 |
6,136 |
11,999 |
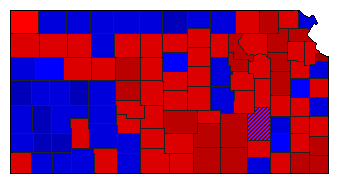
 |  | Secretary of State |
725,585 |
2 |
1 |
0 |
178,150 |
24.55% |
35.46% |
60.01% |
0.00% |
4.53% |
257,279 |
435,429 |
0 |
32,877 |
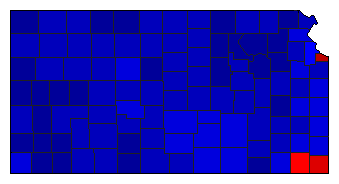
 |  | State Treasurer |
728,606 |
1 |
2 |
0 |
123,448 |
16.94% |
57.43% |
40.49% |
0.00% |
2.09% |
418,428 |
294,980 |
0 |
15,198 |
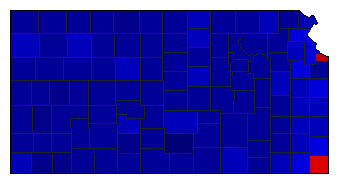 |  | Attorney General |
737,745 |
2 |
1 |
0 |
278,295 |
37.72% |
31.14% |
68.86% |
0.00% |
0.00% |
229,725 |
508,020 |
0 |
0 |
 |  | Insurance Commissioner |
663,594 |
0 |
1 |
0 |
527,450 |
79.48% |
0.00% |
86.90% |
0.00% |
13.10% |
0 |
576,659 |
0 |
86,935 |
|
