1982 General Election Results Comparison - Massachusetts
| Map | Pie | Office | Total | D | R | I | Margin | %Margin | Dem | Rep | Ind | Oth. | Dem | Rep | Ind | Other |
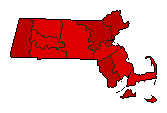 | Senator | 2,050,751 | 1 | 2 | 0 | 462,482 | 22.55% | 60.81% | 38.26% | 0.00% | 0.93% | 1,247,084 | 784,602 | 0 | 19,065 | |
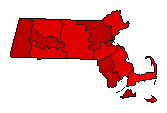 | Governor | 2,050,254 | 1 | 2 | 3 | 469,430 | 22.90% | 59.46% | 36.57% | 3.08% | 0.90% | 1,219,109 | 749,679 | 63,068 | 18,398 | |
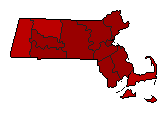 | Secretary of State | 1,884,335 | 1 | 2 | 3 | 912,339 | 48.42% | 72.62% | 24.20% | 3.18% | 0.00% | 1,368,314 | 455,975 | 60,003 | 43 | |
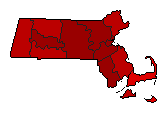 | State Treasurer | 1,900,170 | 1 | 2 | 3 | 831,950 | 43.78% | 70.42% | 26.64% | 2.93% | 0.00% | 1,338,150 | 506,200 | 55,763 | 57 | |
 | Attorney General | 1,987,829 | 1 | 2 | 3 | 1,179,843 | 59.35% | 78.25% | 18.89% | 2.86% | 0.00% | 1,555,400 | 375,557 | 56,836 | 36 | |
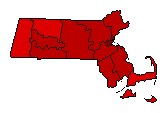 | State Auditor | 1,830,716 | 1 | 2 | 3 | 689,964 | 37.69% | 66.94% | 29.25% | 3.81% | 0.00% | 1,225,427 | 535,463 | 69,795 | 31 |
Massachusetts Results for 1982
Login
© Dave Leip's Atlas of U.S. Elections, LLC 2019 All Rights Reserved
Note: The advertisement links below may advocate political positions that this site does not endorse.
Login
© Dave Leip's Atlas of U.S. Elections, LLC 2019 All Rights Reserved
Note: The advertisement links below may advocate political positions that this site does not endorse.