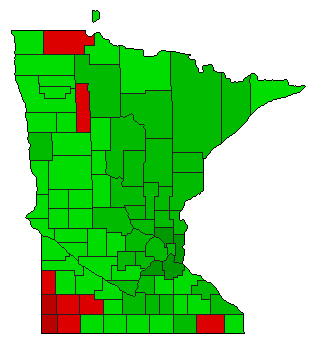
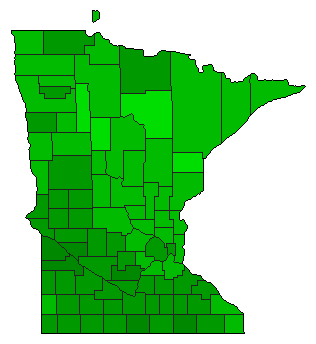
1982 General Election Results Comparison - Minnesota
| Map | Pie | Office | Total | D | R | I | Margin | %Margin | Dem | Rep | Ind | Oth. | Dem | Rep | Ind | Other |
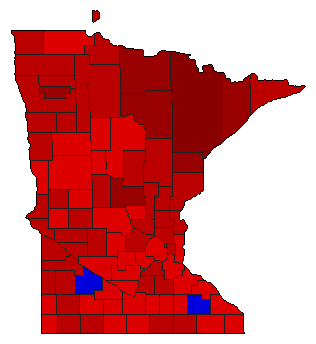
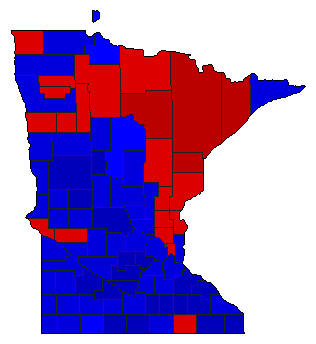 |  | Senator | 1,804,675 | 2 | 1 | 0 | 108,806 | 6.03% | 46.57% | 52.60% | 0.00% | 0.83% | 840,401 | 949,207 | 0 | 15,067 |
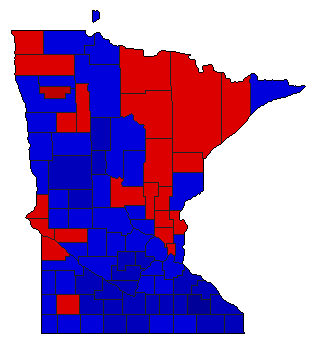
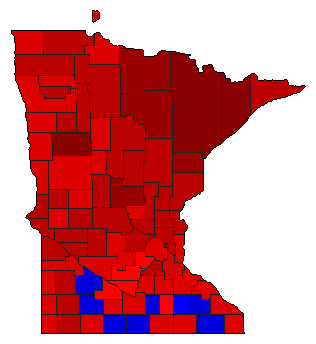 | Governor | 1,785,539 | 1 | 2 | 3 | 337,308 | 18.89% | 58.76% | 39.86% | 0.58% | 0.80% | 1,049,104 | 711,796 | 10,332 | 14,307 | |
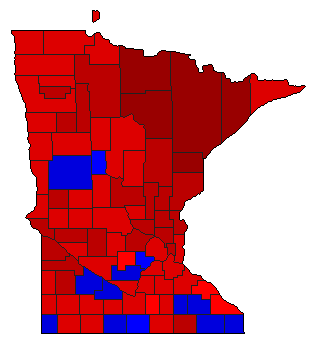 |  | Secretary of State | 1,733,225 | 1 | 2 | 0 | 355,781 | 20.53% | 59.36% | 38.83% | 0.00% | 1.81% | 1,028,792 | 673,011 | 0 | 31,422 |
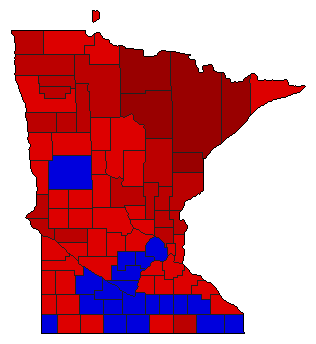 |  | State Treasurer | 1,664,351 | 1 | 2 | 0 | 191,556 | 11.51% | 54.91% | 43.40% | 0.00% | 1.69% | 913,888 | 722,332 | 0 | 28,131 |
 |  | Attorney General | 1,753,979 | 1 | 2 | 0 | 429,377 | 24.48% | 61.72% | 37.24% | 0.00% | 1.04% | 1,082,539 | 653,162 | 0 | 18,278 |
 |  | State Auditor | 1,702,179 | 2 | 1 | 0 | 163,671 | 9.62% | 45.19% | 54.81% | 0.00% | 0.00% | 769,254 | 932,925 | 0 | 0 |
| Map | Pie | Initiative | Total Vote | N | Y | Margin | %Margin | No | Yes | Oth. | No | Yes | ||||
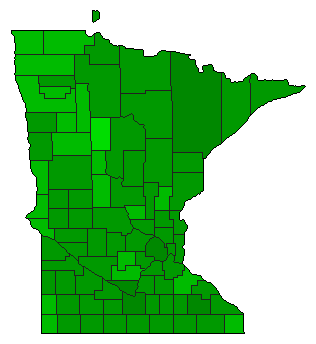 |  | Amendment | 1,689,865 | 2 | 0 | 1 | 918,389 | 54.35% | 22.83% | 0.00% | 77.17% | 0.00% | 385,738 | 0 | 1,304,127 | 0 |
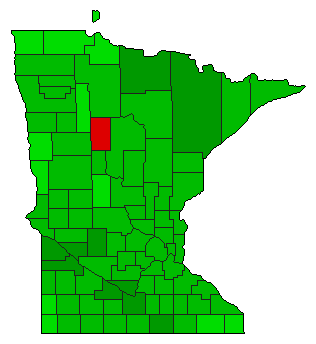 |  | Amendment | 1,677,086 | 2 | 0 | 1 | 529,356 | 31.56% | 34.22% | 0.00% | 65.78% | 0.00% | 573,865 | 0 | 1,103,221 | 0 |
 |  | Amendment | 1,732,976 | 2 | 0 | 1 | 483,534 | 27.90% | 36.05% | 0.00% | 63.95% | 0.00% | 624,721 | 0 | 1,108,255 | 0 |
 |  | Amendment | 1,694,057 | 2 | 0 | 1 | 708,585 | 41.83% | 29.09% | 0.00% | 70.91% | 0.00% | 492,736 | 0 | 1,201,321 | 0 |
Minnesota Results for 1982
Login
© Dave Leip's Atlas of U.S. Elections, LLC 2019 All Rights Reserved
Note: The advertisement links below may advocate political positions that this site does not endorse.
Login
© Dave Leip's Atlas of U.S. Elections, LLC 2019 All Rights Reserved
Note: The advertisement links below may advocate political positions that this site does not endorse.