| Map | Pie | Office | Total | D | R | I | Margin | %Margin | Dem | Rep | Ind | Oth. | Dem | Rep | Ind | Other | | | | | | | | | | | | | | | | | | |
|---|
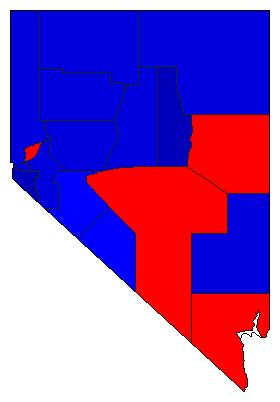
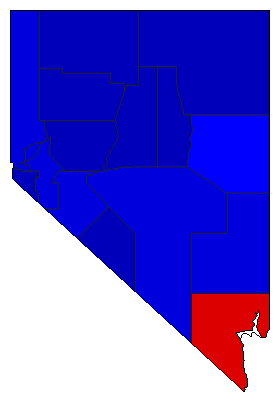 | | Senator |
240,394 |
2 |
1 |
0 |
5,657 |
2.35% |
47.72% |
50.07% |
0.00% |
2.20% |
114,720 |
120,377 |
0 |
5,297 |
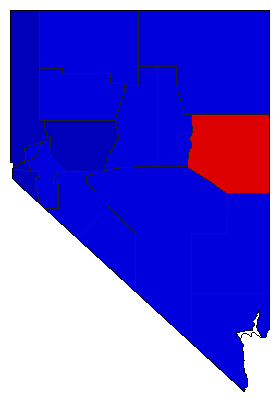
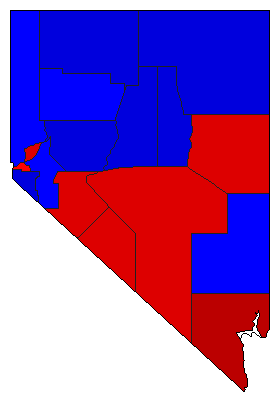 | | Governor |
239,751 |
1 |
2 |
4 |
28,028 |
11.69% |
53.44% |
41.75% |
1.93% |
2.88% |
128,132 |
100,104 |
4,621 |
6,894 |
 | | Lt. Governor |
236,692 |
1 |
2 |
0 |
60,786 |
25.68% |
58.75% |
33.07% |
0.00% |
8.18% |
139,058 |
78,272 |
0 |
19,362 |
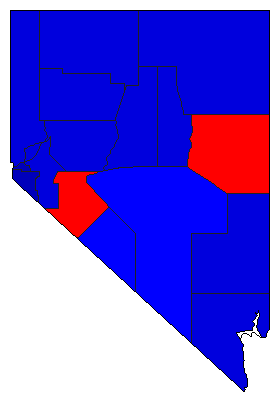
 |  | Secretary of State |
237,465 |
1 |
2 |
3 |
43,420 |
18.28% |
57.49% |
39.20% |
3.31% |
0.00% |
136,516 |
93,096 |
7,853 |
0 |
 |  | State Treasurer |
235,697 |
2 |
1 |
3 |
2,647 |
1.12% |
47.16% |
48.29% |
4.55% |
0.00% |
111,166 |
113,813 |
10,718 |
0 |
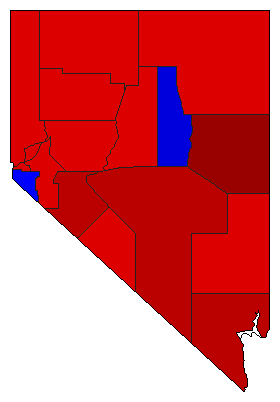
 |  | Attorney General |
237,313 |
2 |
1 |
3 |
28,823 |
12.15% |
42.65% |
54.79% |
2.56% |
0.00% |
101,210 |
130,033 |
6,070 |
0 |
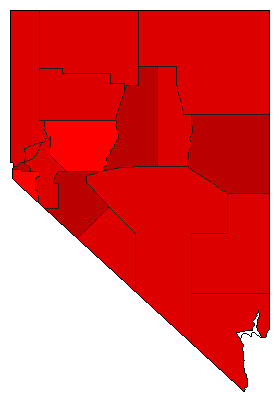
 |  | Controller |
229,203 |
2 |
1 |
3 |
52,455 |
22.89% |
33.86% |
56.75% |
9.40% |
0.00% |
77,607 |
130,062 |
21,534 |
0 |
|
