1982 General Election Results Comparison - New Mexico
| Map | Pie | Office | Total | D | R | I | Margin | %Margin | Dem | Rep | Ind | Oth. | Dem | Rep | Ind | Other |
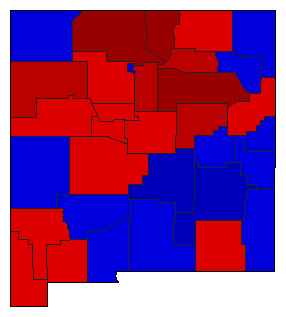 | Senator | 404,810 | 1 | 2 | 0 | 30,554 | 7.55% | 53.77% | 46.23% | 0.00% | 0.00% | 217,682 | 187,128 | 0 | 0 | |
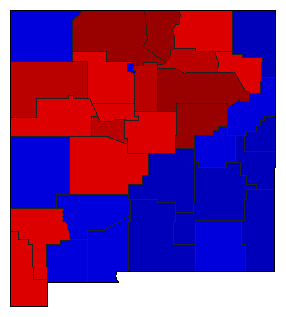 | Governor | 407,466 | 1 | 2 | 0 | 24,214 | 5.94% | 52.97% | 47.03% | 0.00% | 0.00% | 215,840 | 191,626 | 0 | 0 | |
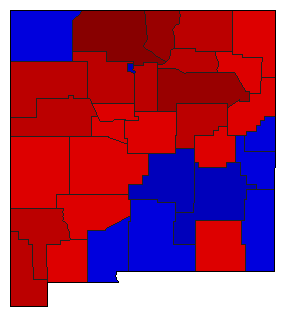 |  | Secretary of State | 380,612 | 1 | 2 | 0 | 31,876 | 8.37% | 54.19% | 45.81% | 0.00% | 0.00% | 206,244 | 174,368 | 0 | 0 |
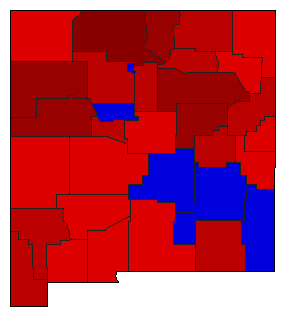 |  | State Treasurer | 374,666 | 1 | 2 | 0 | 48,904 | 13.05% | 56.53% | 43.47% | 0.00% | 0.00% | 211,785 | 162,881 | 0 | 0 |
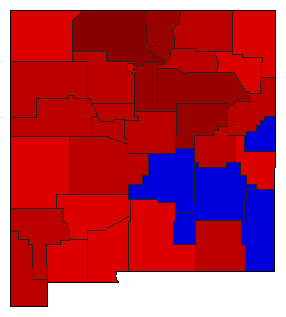 |  | Attorney General | 380,448 | 1 | 2 | 0 | 87,920 | 23.11% | 61.55% | 38.45% | 0.00% | 0.00% | 234,184 | 146,264 | 0 | 0 |
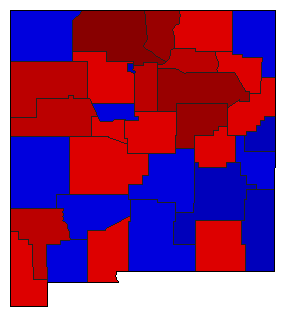 |  | State Auditor | 374,699 | 1 | 2 | 0 | 16,581 | 4.43% | 52.21% | 47.79% | 0.00% | 0.00% | 195,640 | 179,059 | 0 | 0 |
New Mexico Results for 1982
Login
© Dave Leip's Atlas of U.S. Elections, LLC 2019 All Rights Reserved
Note: The advertisement links below may advocate political positions that this site does not endorse.
Login
© Dave Leip's Atlas of U.S. Elections, LLC 2019 All Rights Reserved
Note: The advertisement links below may advocate political positions that this site does not endorse.