| Map | Pie | Office | Total | D | R | I | Margin | %Margin | Dem | Rep | Ind | Oth. | Dem | Rep | Ind | Other | | | | | | | | | | | | | | | | | | |
|---|
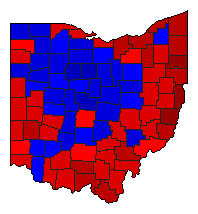 |  | Senator |
3,395,498 |
1 |
2 |
3 |
526,977 |
15.52% |
56.66% |
41.14% |
1.14% |
1.06% |
1,923,767 |
1,396,790 |
38,803 |
36,138 |
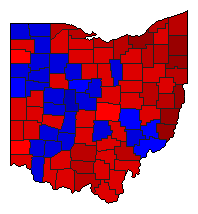 |  | Governor |
3,356,687 |
1 |
2 |
6 |
677,920 |
20.20% |
59.04% |
38.85% |
0.00% |
2.11% |
1,981,882 |
1,303,962 |
7 |
70,836 |
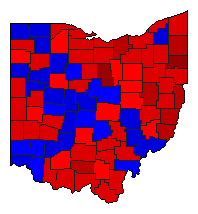 |  | Secretary of State |
3,245,624 |
1 |
2 |
0 |
377,523 |
11.63% |
53.60% |
41.97% |
0.00% |
4.43% |
1,739,602 |
1,362,079 |
0 |
143,943 |
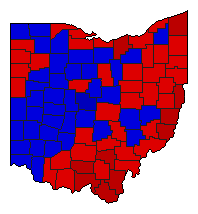
 |  | State Treasurer |
3,207,328 |
1 |
2 |
0 |
71,027 |
2.21% |
48.05% |
45.84% |
0.00% |
6.11% |
1,541,199 |
1,470,172 |
0 |
195,957 |
 |  | Attorney General |
3,322,014 |
1 |
2 |
0 |
832,446 |
25.06% |
61.30% |
36.24% |
0.00% |
2.47% |
2,036,243 |
1,203,797 |
0 |
81,974 |
 |  | State Auditor |
3,242,897 |
1 |
2 |
0 |
142,443 |
4.39% |
52.20% |
47.80% |
0.00% |
0.00% |
1,692,670 |
1,550,227 |
0 |
0 |
|
