1982 General Election Results Comparison - Pennsylvania
| Map | Pie | Office | Total | D | R | I | Margin | %Margin | Dem | Rep | Ind | Oth. | Dem | Rep | Ind | Other |
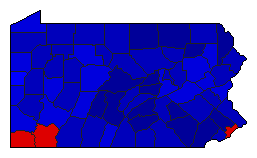 |  | Senator | 3,604,108 | 2 | 1 | 0 | 723,453 | 20.07% | 39.20% | 59.28% | 0.00% | 1.52% | 1,412,965 | 2,136,418 | 0 | 54,725 |
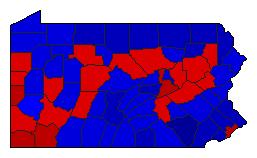 |  | Governor | 3,683,985 | 2 | 1 | 0 | 100,431 | 2.73% | 48.11% | 50.84% | 0.00% | 1.05% | 1,772,353 | 1,872,784 | 0 | 38,848 |
Pennsylvania Results for 1982
Login
© Dave Leip's Atlas of U.S. Elections, LLC 2019 All Rights Reserved
Note: The advertisement links below may advocate political positions that this site does not endorse.
Login
© Dave Leip's Atlas of U.S. Elections, LLC 2019 All Rights Reserved
Note: The advertisement links below may advocate political positions that this site does not endorse.