1982 General Election Results Comparison - South Carolina
| Map | Pie | Office | Total | D | R | I | Margin | %Margin | Dem | Rep | Ind | Oth. | Dem | Rep | Ind | Other |
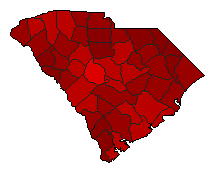 | Governor | 671,777 | 1 | 2 | 0 | 265,981 | 39.59% | 69.78% | 30.19% | 0.00% | 0.03% | 468,787 | 202,806 | 0 | 184 | |
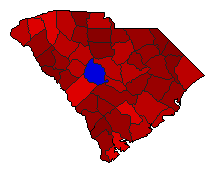 | Lt. Governor | 660,070 | 1 | 2 | 0 | 221,790 | 33.60% | 66.79% | 33.19% | 0.00% | 0.02% | 440,863 | 219,073 | 0 | 134 | |
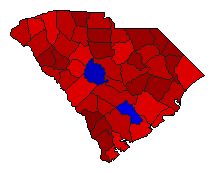 | Attorney General | 656,178 | 1 | 2 | 0 | 139,185 | 21.21% | 60.60% | 39.39% | 0.00% | 0.01% | 397,642 | 258,457 | 0 | 79 | |
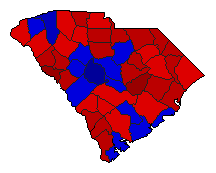 |  | Agriculture Commissioner | 652,306 | 1 | 2 | 0 | 19,195 | 2.94% | 51.47% | 48.52% | 0.00% | 0.01% | 335,718 | 316,523 | 0 | 65 |
South Carolina Results for 1982
Login
© Dave Leip's Atlas of U.S. Elections, LLC 2019 All Rights Reserved
Note: The advertisement links below may advocate political positions that this site does not endorse.
Login
© Dave Leip's Atlas of U.S. Elections, LLC 2019 All Rights Reserved
Note: The advertisement links below may advocate political positions that this site does not endorse.