1982 General Election Results Comparison - Washington
| Map | Pie | Office | Total | D | R | I | Margin | %Margin | Dem | Rep | Ind | Oth. | Dem | Rep | Ind | Other |
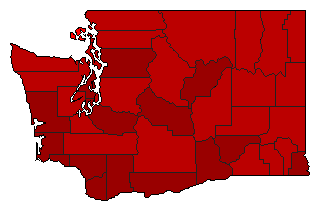 | Senator | 1,368,476 | 1 | 2 | 3 | 611,382 | 44.68% | 68.96% | 24.28% | 5.28% | 1.48% | 943,655 | 332,273 | 72,297 | 20,251 | |
| Map | Pie | Initiative | Total Vote | N | Y | Margin | %Margin | No | Yes | Oth. | No | Yes | ||||
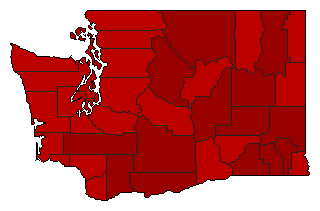 | Initiative | 1,332,845 | 1 | 0 | 2 | 427,425 | 32.07% | 66.03% | 0.00% | 33.97% | 0.00% | 880,135 | 0 | 452,710 | 0 | |
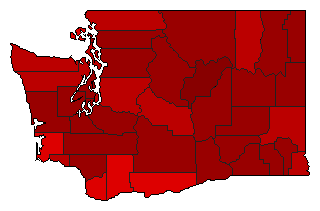 | Initiative | 1,366,107 | 1 | 0 | 2 | 565,795 | 41.42% | 70.71% | 0.00% | 29.29% | 0.00% | 965,951 | 0 | 400,156 | 0 | |
 | Initiative | 1,342,312 | 1 | 0 | 2 | 435,870 | 32.47% | 66.24% | 0.00% | 33.76% | 0.00% | 889,091 | 0 | 453,221 | 0 | |
Washington Results for 1982
Login
© Dave Leip's Atlas of U.S. Elections, LLC 2019 All Rights Reserved
Note: The advertisement links below may advocate political positions that this site does not endorse.
Login
© Dave Leip's Atlas of U.S. Elections, LLC 2019 All Rights Reserved
Note: The advertisement links below may advocate political positions that this site does not endorse.