| Map | Pie | Office | Total | D | R | I | Margin | %Margin | Dem | Rep | Ind | Oth. | Dem | Rep | Ind | Other | | | | | | | | | | | | | | | | | | |
|---|
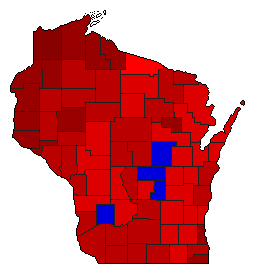 |  | Senator |
1,544,883 |
1 |
2 |
3 |
455,956 |
29.51% |
63.65% |
34.14% |
1.41% |
0.80% |
983,311 |
527,355 |
21,807 |
12,410 |
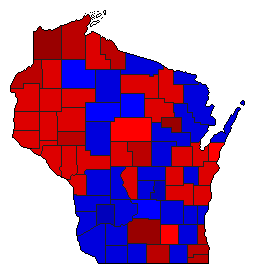 | | Governor |
1,580,090 |
1 |
2 |
3 |
234,134 |
14.82% |
56.76% |
41.94% |
0.62% |
0.68% |
896,872 |
662,738 |
9,734 |
10,746 |
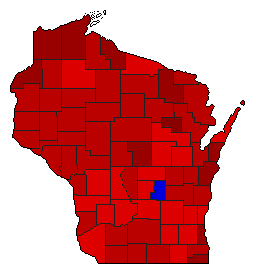 |  | Secretary of State |
1,501,899 |
1 |
2 |
0 |
488,811 |
32.55% |
65.57% |
33.03% |
0.00% |
1.40% |
984,835 |
496,024 |
0 |
21,040 |
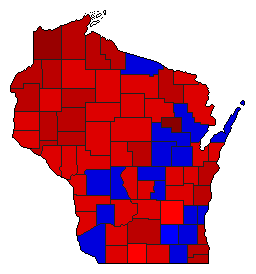 |  | State Treasurer |
1,448,908 |
1 |
2 |
0 |
254,916 |
17.59% |
58.10% |
40.50% |
0.00% |
1.40% |
841,792 |
586,876 |
0 |
20,240 |
 |  | Attorney General |
1,101,969 |
1 |
0 |
0 |
1,035,318 |
93.95% |
96.40% |
0.00% |
0.00% |
3.60% |
1,062,322 |
0 |
0 |
39,647 |
|
