| Map | Pie | Office | Total | D | R | I | Margin | %Margin | Dem | Rep | Ind | Oth. | Dem | Rep | Ind | Other | | | | | | | | | | | | | | | | | | |
|---|
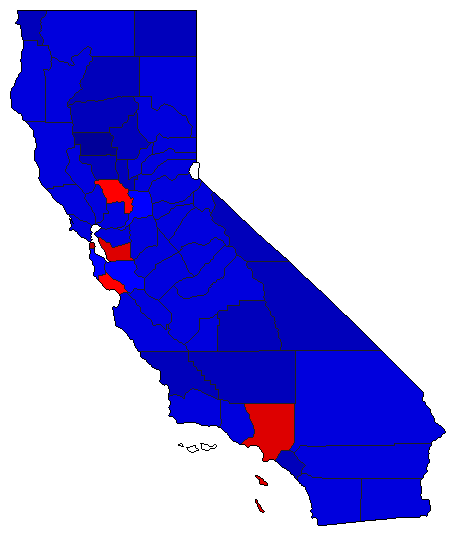 | | Senator |
7,805,350 |
2 |
1 |
0 |
527,597 |
6.76% |
44.78% |
51.54% |
0.00% |
3.69% |
3,494,968 |
4,022,565 |
0 |
287,817 |
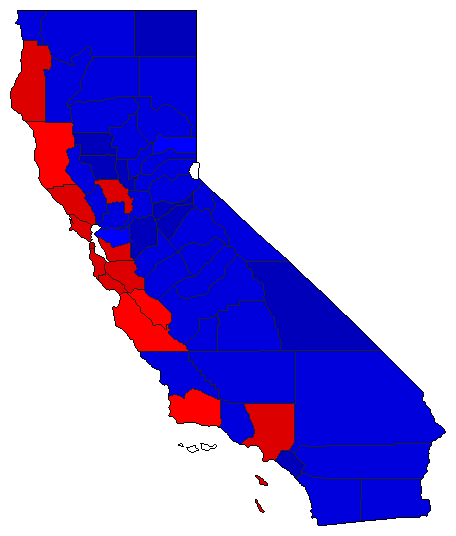 | | Governor |
7,876,335 |
2 |
1 |
0 |
93,345 |
1.19% |
48.09% |
49.27% |
0.00% |
2.64% |
3,787,669 |
3,881,014 |
0 |
207,652 |
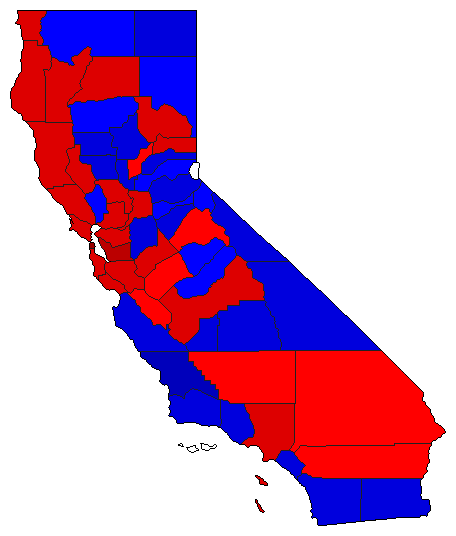 |  | Lt. Governor |
7,664,476 |
1 |
2 |
0 |
619,978 |
8.09% |
52.21% |
44.12% |
0.00% |
3.66% |
4,001,839 |
3,381,861 |
0 |
280,776 |
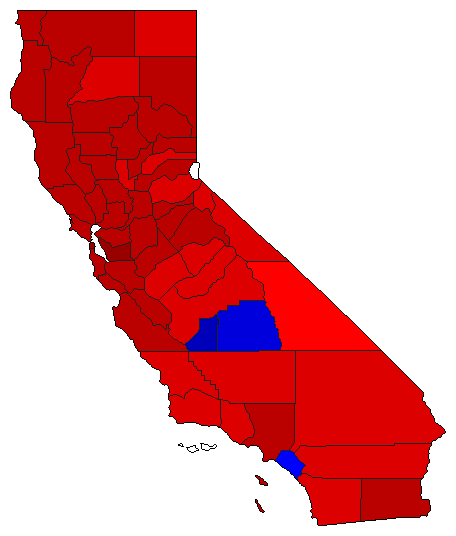 |  | Secretary of State |
7,575,926 |
1 |
2 |
0 |
1,951,580 |
25.76% |
60.54% |
34.78% |
0.00% |
4.69% |
4,586,121 |
2,634,541 |
0 |
355,264 |
 |  | State Treasurer |
7,483,968 |
1 |
2 |
0 |
1,786,845 |
23.88% |
59.28% |
35.41% |
0.00% |
5.31% |
4,436,759 |
2,649,914 |
0 |
397,295 |
 |  | Attorney General |
7,502,034 |
1 |
2 |
0 |
873,957 |
11.65% |
53.53% |
41.88% |
0.00% |
4.59% |
4,015,953 |
3,141,996 |
0 |
344,085 |
 |  | Comptroller General |
7,501,042 |
1 |
2 |
0 |
1,467,828 |
19.57% |
56.59% |
37.02% |
0.00% |
6.39% |
4,244,801 |
2,776,973 |
0 |
479,268 |
 |  | Controller |
7,501,042 |
1 |
2 |
3 |
1,467,828 |
19.57% |
56.59% |
37.02% |
2.45% |
3.94% |
4,244,801 |
2,776,973 |
183,683 |
295,585 |
|
