| Map | Pie | Office | Total | D | R | I | Margin | %Margin | Dem | Rep | Ind | Oth. | Dem | Rep | Ind | Other | | | | | | | | | | | | | | | | | | |
|---|
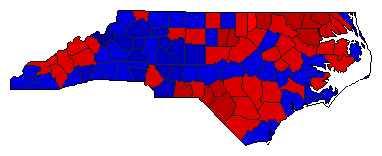
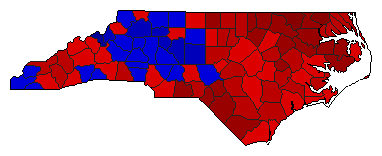
 |  | President |
2,175,361 |
2 |
1 |
- |
522,194 |
24.00% |
37.89% |
61.90% |
0.00% |
0.21% |
824,287 |
1,346,481 |
0 |
4,593 |
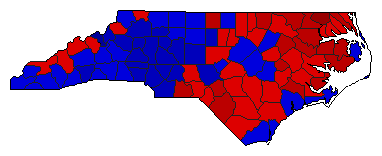
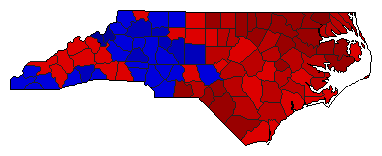
 | | Senator |
2,239,051 |
2 |
1 |
3 |
86,280 |
3.85% |
47.81% |
51.66% |
0.42% |
0.11% |
1,070,488 |
1,156,768 |
9,302 |
2,493 |
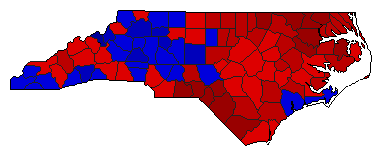
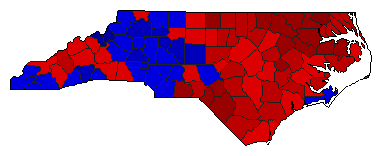
 | | Governor |
2,226,437 |
2 |
1 |
3 |
197,268 |
8.86% |
45.40% |
54.27% |
0.21% |
0.12% |
1,010,909 |
1,208,177 |
4,611 |
2,740 |
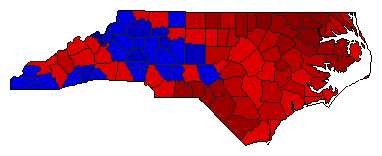
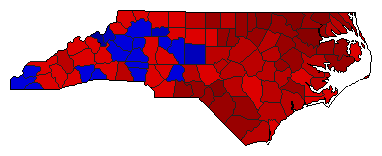
 |  | Lt. Governor |
2,139,942 |
1 |
2 |
0 |
158,486 |
7.41% |
53.70% |
46.30% |
0.00% |
0.00% |
1,149,214 |
990,728 |
0 |
0 |
 |  | Secretary of State |
2,076,787 |
1 |
2 |
0 |
256,289 |
12.34% |
56.17% |
43.83% |
0.00% |
0.00% |
1,166,538 |
910,249 |
0 |
0 |
 |  | Attorney General |
2,035,432 |
1 |
2 |
0 |
194,102 |
9.54% |
54.77% |
45.23% |
0.00% |
0.00% |
1,114,767 |
920,665 |
0 |
0 |
 |  | State Auditor |
2,016,773 |
1 |
2 |
0 |
171,521 |
8.50% |
54.25% |
45.75% |
0.00% |
0.00% |
1,094,147 |
922,626 |
0 |
0 |
 |  | Insurance Commissioner |
2,038,479 |
1 |
2 |
0 |
168,675 |
8.27% |
54.14% |
45.86% |
0.00% |
0.00% |
1,103,577 |
934,902 |
0 |
0 |
 |  | Agriculture Commissioner |
2,045,680 |
1 |
2 |
0 |
360,222 |
17.61% |
58.80% |
41.20% |
0.00% |
0.00% |
1,202,951 |
842,729 |
0 |
0 |
|
