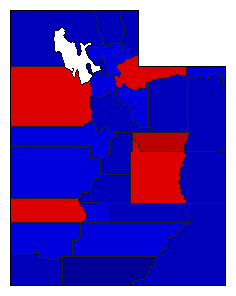
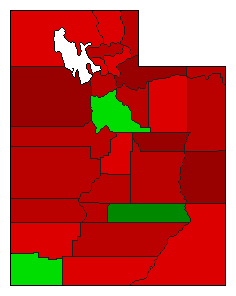
1984 General Election Results Comparison - Utah
| Map | Pie | Office | Total | D | R | I | Margin | %Margin | Dem | Rep | Ind | Oth. | Dem | Rep | Ind | Other |
 |  | President | 629,656 | 2 | 1 | - | 313,736 | 49.83% | 24.68% | 74.50% | 0.00% | 0.82% | 155,369 | 469,105 | 0 | 5,182 |
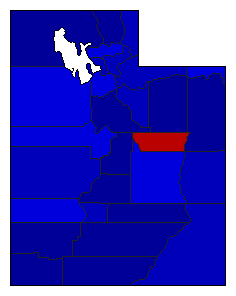
 | Governor | 629,619 | 2 | 1 | 0 | 76,123 | 12.09% | 43.78% | 55.87% | 0.00% | 0.34% | 275,669 | 351,792 | 0 | 2,158 | |
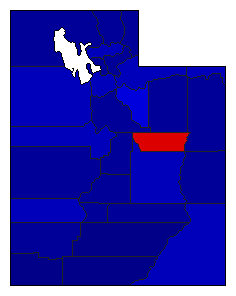
 | State Treasurer | 598,845 | 2 | 1 | 0 | 161,959 | 27.05% | 36.48% | 63.52% | 0.00% | 0.00% | 218,443 | 380,402 | 0 | 0 | |
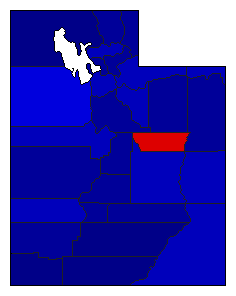
 | Attorney General | 602,877 | 2 | 1 | 0 | 225,315 | 37.37% | 31.31% | 68.69% | 0.00% | 0.00% | 188,781 | 414,096 | 0 | 0 | |
 | State Auditor | 586,707 | 2 | 1 | 0 | 227,035 | 38.70% | 30.65% | 69.35% | 0.00% | 0.00% | 179,836 | 406,871 | 0 | 0 | |
| Map | Pie | Initiative | Total Vote | N | Y | Margin | %Margin | No | Yes | Oth. | No | Yes | ||||
 | Initiative | 612,095 | 1 | 0 | 2 | 134,627 | 21.99% | 61.00% | 0.00% | 39.00% | 0.00% | 373,361 | 0 | 238,734 | 0 | |
Utah Results for 1984
Login
© Dave Leip's Atlas of U.S. Elections, LLC 2019 All Rights Reserved
Note: The advertisement links below may advocate political positions that this site does not endorse.
Login
© Dave Leip's Atlas of U.S. Elections, LLC 2019 All Rights Reserved
Note: The advertisement links below may advocate political positions that this site does not endorse.