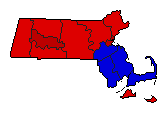
1986 General Election Results Comparison - Massachusetts
| Map | Pie | Office | Total | D | R | I | Margin | %Margin | Dem | Rep | Ind | Oth. | Dem | Rep | Ind | Other |
 | Governor | 1,684,079 | 1 | 2 | 0 | 632,422 | 37.55% | 68.75% | 31.20% | 0.00% | 0.06% | 1,157,786 | 525,364 | 0 | 929 | |
 |  | Secretary of State | 1,604,952 | 1 | 2 | 0 | 577,986 | 36.01% | 68.00% | 31.99% | 0.00% | 0.00% | 1,091,441 | 513,455 | 0 | 56 |
 |  | State Treasurer | 1,624,224 | 1 | 2 | 0 | 236,327 | 14.55% | 57.26% | 42.71% | 0.00% | 0.02% | 930,074 | 693,747 | 0 | 403 |
 |  | Attorney General | 1,647,015 | 1 | 2 | 0 | 153,297 | 9.31% | 54.65% | 45.34% | 0.00% | 0.01% | 900,088 | 746,791 | 0 | 136 |
 |  | State Auditor | 1,584,617 | 1 | 2 | 0 | 417,937 | 26.37% | 63.18% | 36.81% | 0.00% | 0.01% | 1,001,236 | 583,299 | 0 | 82 |
Massachusetts Results for 1986
Login
© Dave Leip's Atlas of U.S. Elections, LLC 2019 All Rights Reserved
Note: The advertisement links below may advocate political positions that this site does not endorse.
Login
© Dave Leip's Atlas of U.S. Elections, LLC 2019 All Rights Reserved
Note: The advertisement links below may advocate political positions that this site does not endorse.