1986 General Election Results Comparison - Minnesota
| Map | Pie | Office | Total | D | R | I | Margin | %Margin | Dem | Rep | Ind | Oth. | Dem | Rep | Ind | Other |
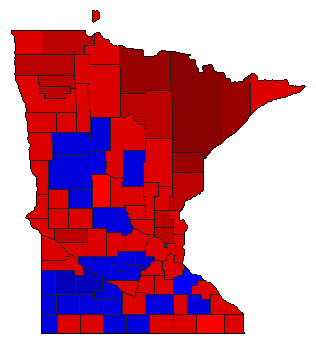 | Governor | 1,408,104 | 1 | 2 | 3 | 183,383 | 13.02% | 56.11% | 43.09% | 0.30% | 0.50% | 790,138 | 606,755 | 4,208 | 7,003 | |
 |  | Secretary of State | 1,371,913 | 1 | 2 | 0 | 452,059 | 32.95% | 66.48% | 33.52% | 0.00% | 0.00% | 911,986 | 459,927 | 0 | 0 |
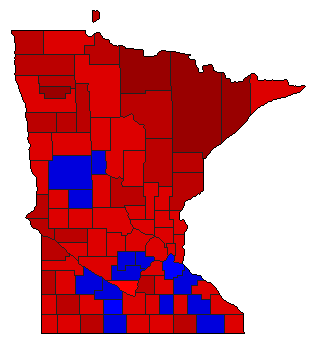 |  | State Treasurer | 1,344,468 | 1 | 2 | 0 | 151,637 | 11.28% | 55.13% | 43.85% | 0.00% | 1.03% | 741,144 | 589,507 | 0 | 13,817 |
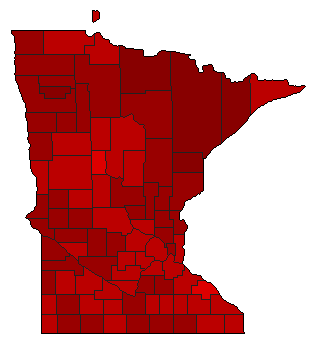 |  | Attorney General | 1,402,245 | 1 | 2 | 0 | 586,086 | 41.80% | 70.29% | 28.49% | 0.00% | 1.23% | 985,569 | 399,483 | 0 | 17,193 |
 |  | State Auditor | 1,356,132 | 2 | 1 | 0 | 138,306 | 10.20% | 44.90% | 55.10% | 0.00% | 0.00% | 608,913 | 747,219 | 0 | 0 |
Minnesota Results for 1986
Login
© Dave Leip's Atlas of U.S. Elections, LLC 2019 All Rights Reserved
Note: The advertisement links below may advocate political positions that this site does not endorse.
Login
© Dave Leip's Atlas of U.S. Elections, LLC 2019 All Rights Reserved
Note: The advertisement links below may advocate political positions that this site does not endorse.