| Map | Pie | Office | Total | D | R | I | Margin | %Margin | Dem | Rep | Ind | Oth. | Dem | Rep | Ind | Other | | | | | | | | | | | | | | | | | | |
|---|
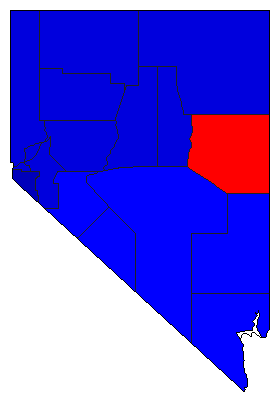
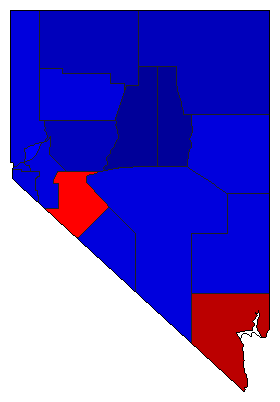 |  | Senator |
261,932 |
1 |
2 |
4 |
14,349 |
5.48% |
50.00% |
44.52% |
1.87% |
3.62% |
130,955 |
116,606 |
4,899 |
9,472 |
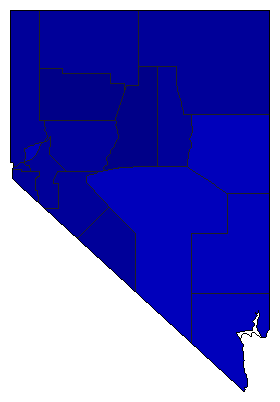
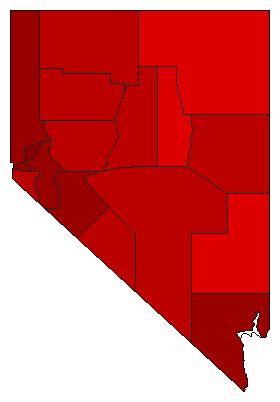 | | Governor |
260,375 |
1 |
2 |
4 |
122,187 |
46.93% |
71.92% |
25.00% |
0.98% |
2.10% |
187,268 |
65,081 |
2,555 |
5,471 |
 |  | Lt. Governor |
259,907 |
1 |
2 |
3 |
25,229 |
9.71% |
53.60% |
43.89% |
2.52% |
0.00% |
139,299 |
114,070 |
6,538 |
0 |
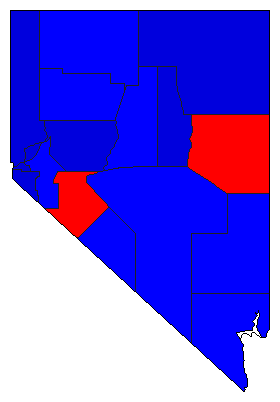
 |  | Secretary of State |
257,680 |
1 |
2 |
4 |
26,907 |
10.44% |
51.57% |
41.12% |
3.02% |
4.29% |
132,873 |
105,966 |
7,786 |
11,055 |
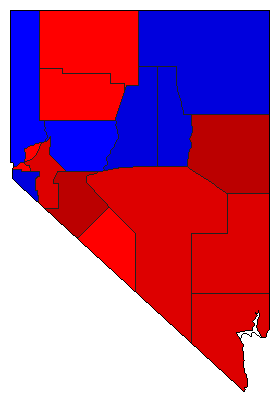
 |  | State Treasurer |
252,705 |
2 |
1 |
4 |
30,785 |
12.18% |
38.81% |
50.99% |
3.04% |
7.16% |
98,070 |
128,855 |
7,675 |
18,105 |
 |  | Attorney General |
258,382 |
2 |
1 |
3 |
111,234 |
43.05% |
27.20% |
70.25% |
2.54% |
0.00% |
70,289 |
181,523 |
6,570 |
0 |
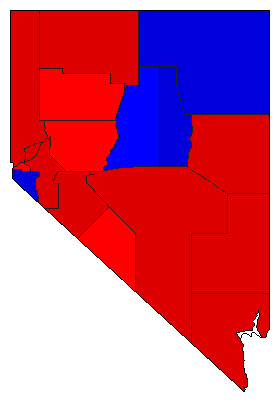
 |  | Controller |
251,992 |
2 |
1 |
3 |
15,458 |
6.13% |
43.34% |
49.47% |
7.19% |
0.00% |
109,208 |
124,666 |
18,118 |
0 |
|
