| Map | Pie | Office | Total | D | R | I | Margin | %Margin | Dem | Rep | Ind | Oth. | Dem | Rep | Ind | Other | | | | | | | | | | | | | | | | | | |
|---|
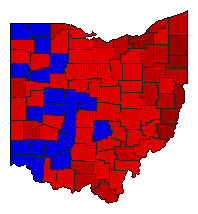
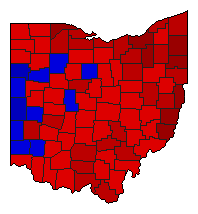 |  | Senator |
3,121,189 |
1 |
2 |
0 |
777,315 |
24.90% |
62.45% |
37.55% |
0.00% |
0.00% |
1,949,208 |
1,171,893 |
0 |
88 |
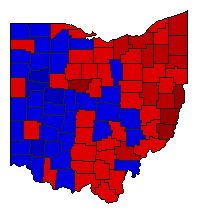
 |  | Governor |
3,066,611 |
1 |
2 |
0 |
651,108 |
21.23% |
60.60% |
39.37% |
0.00% |
0.03% |
1,858,372 |
1,207,264 |
0 |
975 |
 |  | Secretary of State |
3,023,636 |
1 |
2 |
0 |
588,030 |
19.45% |
59.72% |
40.28% |
0.00% |
0.00% |
1,805,833 |
1,217,803 |
0 |
0 |
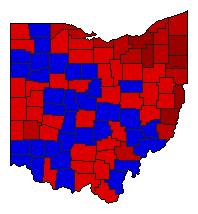
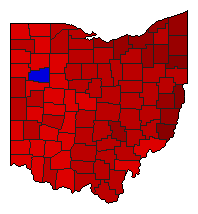
 |  | State Treasurer |
3,001,180 |
1 |
2 |
0 |
295,958 |
9.86% |
54.93% |
45.07% |
0.00% |
0.00% |
1,648,569 |
1,352,611 |
0 |
0 |
 |  | Attorney General |
3,043,689 |
1 |
2 |
0 |
599,485 |
19.70% |
59.85% |
40.15% |
0.00% |
0.00% |
1,821,587 |
1,222,102 |
0 |
0 |
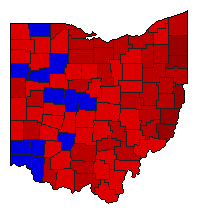
 |  | State Auditor |
3,017,343 |
1 |
2 |
0 |
993,269 |
32.92% |
66.46% |
33.54% |
0.00% |
0.00% |
2,005,306 |
1,012,037 |
0 |
0 |
|
