| Map | Pie | Office | Total | D | R | I | Margin | %Margin | Dem | Rep | Ind | Oth. | Dem | Rep | Ind | Other | | | | | | | | | | | | | | | | | | |
|---|
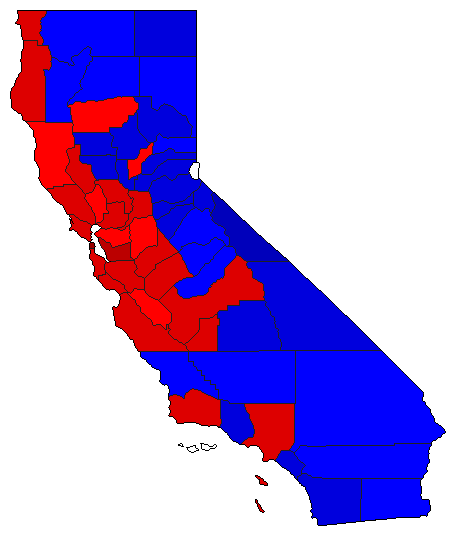
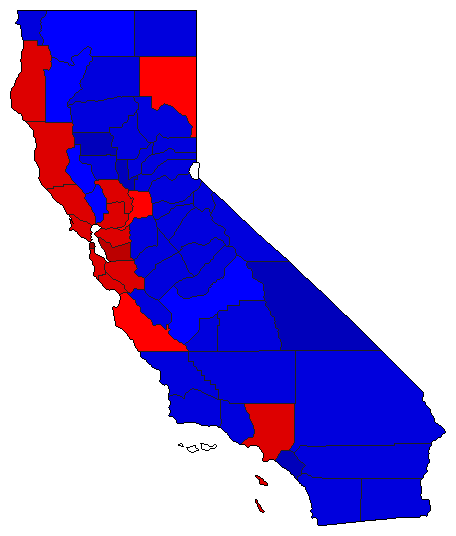 | | Senator |
7,398,522 |
1 |
2 |
0 |
104,868 |
1.42% |
49.29% |
47.87% |
0.00% |
2.84% |
3,646,672 |
3,541,804 |
0 |
210,046 |
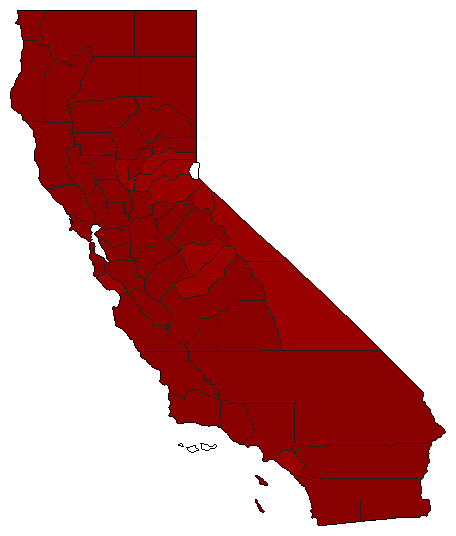
 | | Governor |
7,443,485 |
2 |
1 |
0 |
1,724,887 |
23.17% |
37.37% |
60.54% |
0.00% |
2.08% |
2,781,714 |
4,506,601 |
0 |
155,170 |
 | | Lt. Governor |
7,338,124 |
1 |
2 |
0 |
839,073 |
11.43% |
53.94% |
42.50% |
0.00% |
3.56% |
3,957,831 |
3,118,758 |
0 |
261,535 |
 |  | Secretary of State |
7,221,144 |
1 |
2 |
0 |
3,062,366 |
42.41% |
68.84% |
26.43% |
0.00% |
4.72% |
4,971,230 |
1,908,864 |
0 |
341,050 |
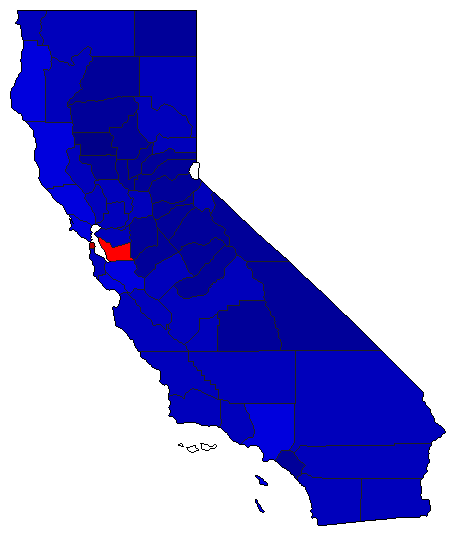
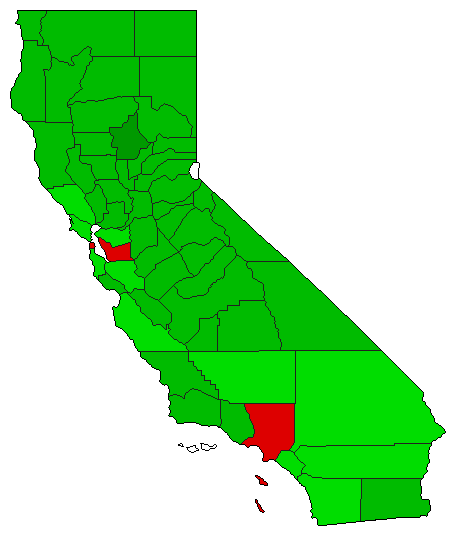
 |  | State Treasurer |
6,756,546 |
1 |
0 |
0 |
5,020,353 |
74.30% |
82.73% |
0.00% |
0.00% |
17.27% |
5,589,633 |
0 |
0 |
1,166,913 |
 |  | Attorney General |
7,108,676 |
1 |
2 |
0 |
2,572,515 |
36.19% |
65.99% |
29.80% |
0.00% |
4.20% |
4,691,142 |
2,118,627 |
0 |
298,907 |
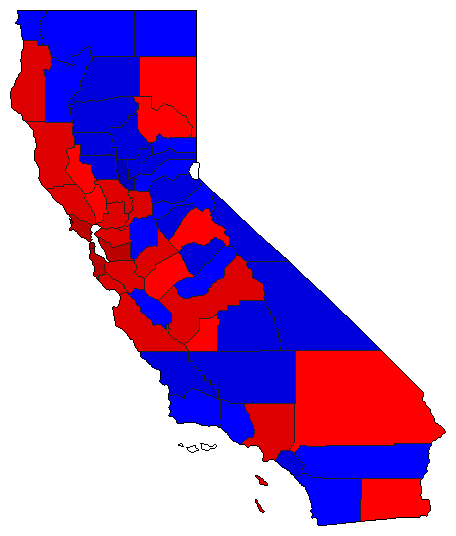
 |  | Controller |
7,135,161 |
1 |
2 |
0 |
524,073 |
7.34% |
51.48% |
44.14% |
0.00% |
4.38% |
3,673,432 |
3,149,359 |
0 |
312,370 |
| | | Map | Pie | Initiative | Total Vote | N | | Y | Margin | %Margin | No | | Yes | Oth. | No | | Yes | |
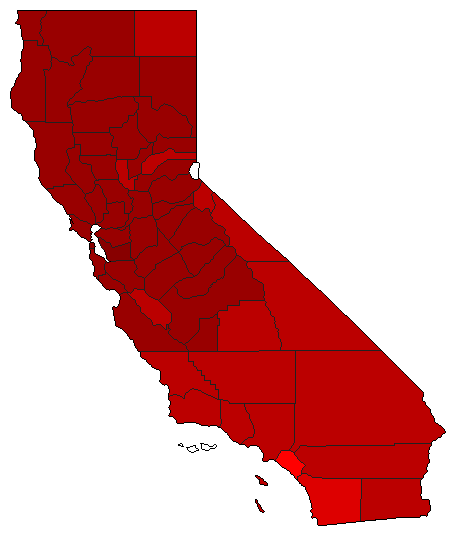
 | | Referendum |
4,097,983 |
2 |
0 |
1 |
487,373 |
11.89% |
44.05% |
0.00% |
55.95% |
0.00% |
1,805,305 |
0 |
2,292,678 |
0 |
|
