| Map | Pie | Year | Total | D | R | I | Margin | %Margin | Dem | Rep | Ind | Oth. | Dem | Rep | Ind | Other | | | | | | | | | | | | | | | | | | |
|---|
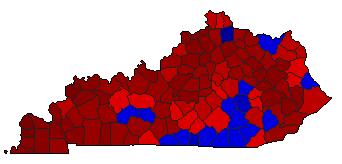
|  | 2023 |
1,297,440 |
2 |
1 |
0 |
207,944 |
16.03% |
41.99% |
58.01% |
0.00% |
0.00% |
544,748 |
752,692 |
0 |
0 |
 |  | 2019 |
1,425,618 |
2 |
1 |
0 |
221,074 |
15.51% |
42.25% |
57.75% |
0.00% |
0.00% |
602,272 |
823,346 |
0 |
0 |
 |  | 2015 |
957,658 |
1 |
2 |
0 |
2,190 |
0.23% |
50.11% |
49.89% |
0.00% |
0.00% |
479,924 |
477,734 |
0 |
0 |
 | | 2011 |
817,240 |
1 |
2 |
0 |
81,986 |
10.03% |
55.02% |
44.98% |
0.00% |
0.00% |
449,613 |
367,627 |
0 |
0 |
 | | 2007 |
1,012,292 |
1 |
2 |
0 |
213,086 |
21.05% |
60.52% |
39.48% |
0.00% |
0.00% |
612,689 |
399,603 |
0 |
0 |
 | | 2003 |
1,032,191 |
1 |
2 |
3 |
62,387 |
6.04% |
47.72% |
41.67% |
10.61% |
0.00% |
492,540 |
430,153 |
109,498 |
0 |
 | | 1995 |
935,813 |
1 |
2 |
0 |
185,239 |
19.79% |
59.90% |
40.10% |
0.00% |
0.00% |
560,526 |
375,287 |
0 |
0 |
 | | 1991 |
731,150 |
1 |
2 |
0 |
170,036 |
23.26% |
61.63% |
38.37% |
0.00% |
0.00% |
450,593 |
280,557 |
0 |
0 |
 | | 1987 |
653,430 |
1 |
2 |
0 |
260,716 |
39.90% |
69.94% |
30.04% |
0.00% |
0.02% |
457,008 |
196,292 |
0 |
130 |
 | | 1983 |
823,765 |
1 |
2 |
0 |
287,669 |
34.92% |
67.46% |
32.54% |
0.00% |
0.00% |
555,717 |
268,048 |
0 |
0 |
 |  | 1979 |
774,128 |
1 |
2 |
0 |
168,226 |
21.73% |
60.87% |
39.13% |
0.00% |
0.00% |
471,177 |
302,951 |
0 |
0 |
 | | 1975 |
629,109 |
1 |
2 |
0 |
179,151 |
28.48% |
64.24% |
35.76% |
0.00% |
0.00% |
404,130 |
224,979 |
0 |
0 |
|
