| Map | Pie | Office | Total | D | R | I | Margin | %Margin | Dem | Rep | Ind | Oth. | Dem | Rep | Ind | Other | | | | | | | | | | | | | | | | | | |
|---|
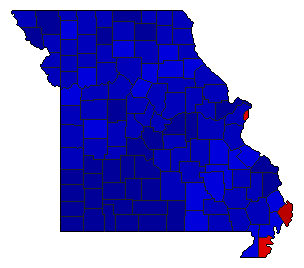
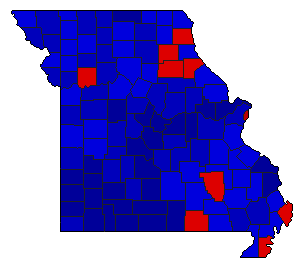
 |  | President |
2,093,228 |
2 |
1 |
- |
83,334 |
3.98% |
47.85% |
51.83% |
0.00% |
0.32% |
1,001,619 |
1,084,953 |
0 |
6,656 |
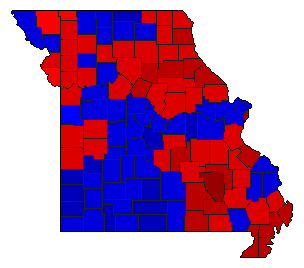
 | | Senator |
2,078,871 |
2 |
1 |
0 |
747,371 |
35.95% |
31.75% |
67.70% |
0.00% |
0.55% |
660,045 |
1,407,416 |
0 |
11,410 |
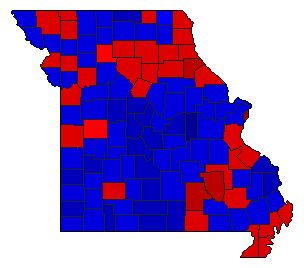
 | | Governor |
2,085,917 |
2 |
1 |
0 |
614,612 |
29.46% |
34.75% |
64.22% |
0.00% |
1.03% |
724,919 |
1,339,531 |
0 |
21,467 |
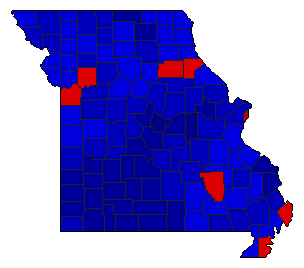
 | | Lt. Governor |
2,034,997 |
1 |
2 |
0 |
96,609 |
4.75% |
51.81% |
47.06% |
0.00% |
1.13% |
1,054,307 |
957,698 |
0 |
22,992 |
 | | Secretary of State |
2,035,271 |
2 |
1 |
0 |
454,823 |
22.35% |
38.40% |
60.75% |
0.00% |
0.85% |
781,594 |
1,236,417 |
0 |
17,260 |
 | | State Treasurer |
2,025,371 |
2 |
1 |
0 |
42,090 |
2.08% |
48.48% |
50.56% |
0.00% |
0.96% |
981,919 |
1,024,009 |
0 |
19,443 |
 | | Attorney General |
2,020,563 |
2 |
1 |
0 |
428,129 |
21.19% |
39.41% |
60.59% |
0.00% |
0.00% |
796,217 |
1,224,346 |
0 |
0 |
|
