| Map | Pie | Office | Total | D | R | I | Margin | %Margin | Dem | Rep | Ind | Oth. | Dem | Rep | Ind | Other | | | | | | | | | | | | | | | | | | |
|---|
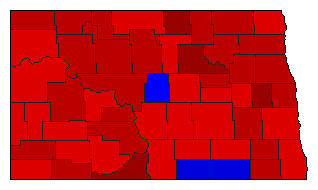
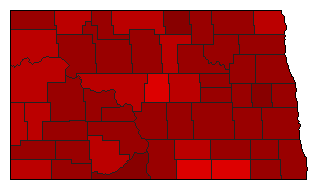
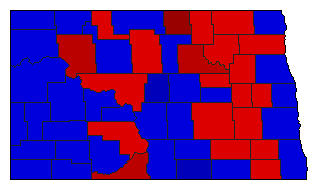
 |  | President |
297,261 |
2 |
1 |
- |
38,820 |
13.06% |
42.97% |
56.03% |
0.00% |
1.00% |
127,739 |
166,559 |
0 |
2,963 |
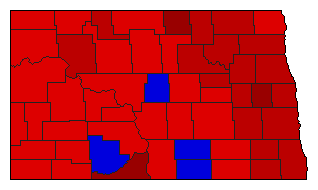
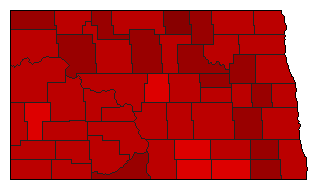
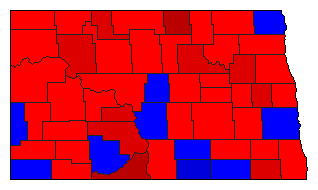
 | | Senator |
289,170 |
1 |
2 |
0 |
58,962 |
20.39% |
59.45% |
39.06% |
0.00% |
1.50% |
171,899 |
112,937 |
0 |
4,334 |
 | | Governor |
299,080 |
1 |
2 |
0 |
59,108 |
19.76% |
59.88% |
40.12% |
0.00% |
0.00% |
179,094 |
119,986 |
0 |
0 |
 |  | Secretary of State |
283,986 |
1 |
2 |
0 |
12,314 |
4.34% |
52.17% |
47.83% |
0.00% |
0.00% |
148,150 |
135,836 |
0 |
0 |
 |  | State Treasurer |
286,221 |
1 |
2 |
0 |
27,571 |
9.63% |
54.82% |
45.18% |
0.00% |
0.00% |
156,896 |
129,325 |
0 |
0 |
 |  | Attorney General |
291,460 |
1 |
2 |
0 |
135,648 |
46.54% |
73.27% |
26.73% |
0.00% |
0.00% |
213,554 |
77,906 |
0 |
0 |
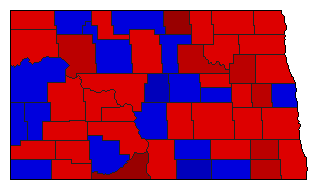
 |  | State Auditor |
285,948 |
2 |
1 |
0 |
7,488 |
2.62% |
48.69% |
51.31% |
0.00% |
0.00% |
139,230 |
146,718 |
0 |
0 |
 |  | Insurance Commissioner |
289,214 |
1 |
2 |
0 |
102,970 |
35.60% |
67.80% |
32.20% |
0.00% |
0.00% |
196,092 |
93,122 |
0 |
0 |
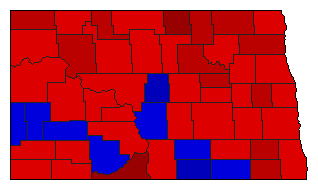
 |  | Agriculture Commissioner |
294,391 |
1 |
2 |
3 |
17,142 |
5.82% |
45.16% |
39.34% |
14.06% |
1.44% |
132,959 |
115,817 |
41,386 |
4,229 |
|
