| Map | Pie | Office | Total | D | R | I | Margin | %Margin | Dem | Rep | Ind | Oth. | Dem | Rep | Ind | Other | | | | | | | | | | | | | | | | | | |
|---|
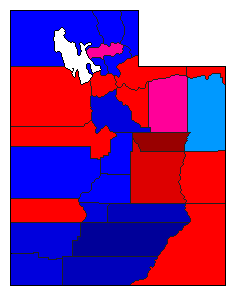
 |  | President |
647,008 |
2 |
1 |
- |
221,099 |
34.17% |
32.05% |
66.22% |
0.00% |
1.73% |
207,343 |
428,442 |
0 |
11,223 |
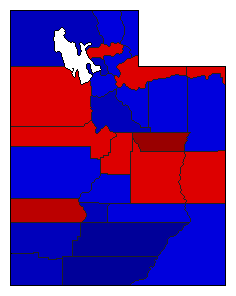
 | | Senator |
640,697 |
2 |
1 |
0 |
226,720 |
35.39% |
31.74% |
67.13% |
0.00% |
1.13% |
203,364 |
430,084 |
0 |
7,249 |
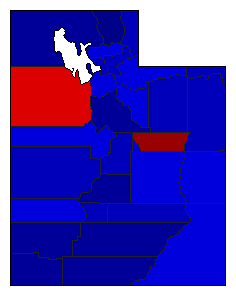
 | | Governor |
649,114 |
2 |
1 |
3 |
11,141 |
1.72% |
38.41% |
40.13% |
21.05% |
0.41% |
249,321 |
260,462 |
136,651 |
2,680 |
 | | State Treasurer |
608,352 |
2 |
1 |
0 |
48,408 |
7.96% |
46.02% |
53.98% |
0.00% |
0.00% |
279,972 |
328,380 |
0 |
0 |
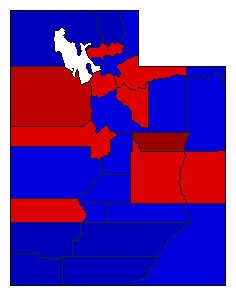 | | Attorney General |
631,094 |
1 |
2 |
0 |
28,218 |
4.47% |
52.24% |
47.76% |
0.00% |
0.00% |
329,656 |
301,438 |
0 |
0 |
 | | State Auditor |
594,447 |
2 |
1 |
0 |
140,033 |
23.56% |
38.22% |
61.78% |
0.00% |
0.00% |
227,207 |
367,240 |
0 |
0 |
|
