| Map | Pie | Office | Total | D | R | I | Margin | %Margin | Dem | Rep | Ind | Oth. | Dem | Rep | Ind | Other | | | | | | | | | | | | | | | | | | |
|---|
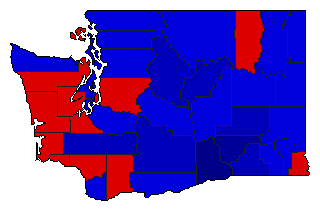
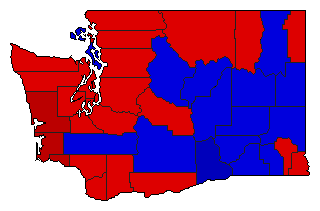
 |  | President |
1,865,253 |
1 |
2 |
- |
29,681 |
1.59% |
50.05% |
48.46% |
0.00% |
1.50% |
933,516 |
903,835 |
0 |
27,902 |
 | | Senator |
1,848,542 |
2 |
1 |
0 |
40,176 |
2.17% |
48.91% |
51.09% |
0.00% |
0.00% |
904,183 |
944,359 |
0 |
0 |
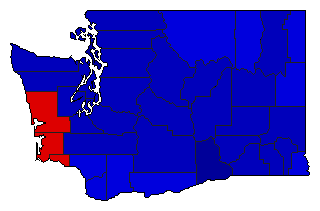
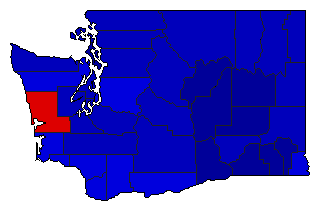
 | | Governor |
1,874,929 |
1 |
2 |
0 |
457,967 |
24.43% |
62.21% |
37.79% |
0.00% |
0.00% |
1,166,448 |
708,481 |
0 |
0 |
 | | Lt. Governor |
1,800,218 |
2 |
1 |
0 |
121,092 |
6.73% |
46.64% |
53.36% |
0.00% |
0.00% |
839,563 |
960,655 |
0 |
0 |
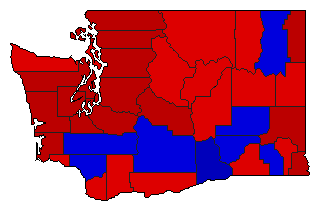
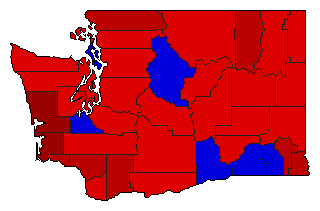
 | | Secretary of State |
1,749,104 |
2 |
1 |
0 |
443,010 |
25.33% |
37.34% |
62.66% |
0.00% |
0.00% |
653,047 |
1,096,057 |
0 |
0 |
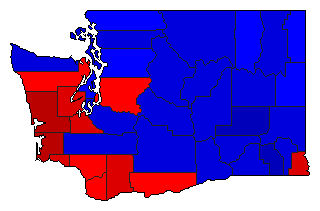
 | | State Treasurer |
1,755,101 |
1 |
2 |
0 |
75,349 |
4.29% |
52.15% |
47.85% |
0.00% |
0.00% |
915,225 |
839,876 |
0 |
0 |
 | | Attorney General |
1,789,389 |
2 |
1 |
0 |
417,085 |
23.31% |
38.35% |
61.65% |
0.00% |
0.00% |
686,152 |
1,103,237 |
0 |
0 |
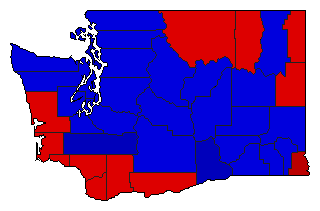
 | | Comptroller General |
1,724,799 |
2 |
1 |
0 |
42,763 |
2.48% |
47.00% |
49.48% |
0.00% |
3.52% |
810,658 |
853,421 |
0 |
60,720 |
 | | State Auditor |
1,728,663 |
1 |
2 |
0 |
187,749 |
10.86% |
55.43% |
44.57% |
0.00% |
0.00% |
958,206 |
770,457 |
0 |
0 |
 | | Insurance Commissioner |
1,729,849 |
0 |
1 |
2 |
224,309 |
12.97% |
0.00% |
56.48% |
43.52% |
0.00% |
0 |
977,079 |
752,770 |
0 |
|
