| Map | Pie | Year | Total | D | R | I | Margin | %Margin | Dem | Rep | Ind | Oth. | Dem | Rep | Ind | Other | | | | | | | | | | | | | | | | | | |
|---|
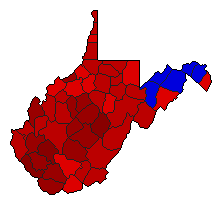
 |  | 2020 |
739,298 |
2 |
1 |
0 |
221,474 |
29.96% |
35.02% |
64.98% |
0.00% |
0.00% |
258,912 |
480,386 |
0 |
0 |
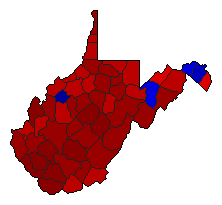
 |  | 2016 |
664,253 |
2 |
1 |
0 |
47,369 |
7.13% |
41.28% |
48.41% |
0.00% |
10.31% |
274,191 |
321,560 |
0 |
68,502 |
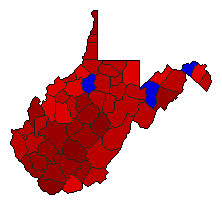
 | | 2012 |
613,679 |
1 |
2 |
0 |
19,503 |
3.18% |
51.59% |
48.41% |
0.00% |
0.00% |
316,591 |
297,088 |
0 |
0 |
 | | 2008 |
663,738 |
1 |
2 |
0 |
40,746 |
6.14% |
53.07% |
46.93% |
0.00% |
0.00% |
352,242 |
311,496 |
0 |
0 |
 | | 2004 |
691,283 |
1 |
2 |
0 |
184,479 |
26.69% |
63.34% |
36.66% |
0.00% |
0.00% |
437,881 |
253,402 |
0 |
0 |
 | | 1996 |
557,634 |
1 |
2 |
0 |
246,288 |
44.17% |
72.08% |
27.92% |
0.00% |
0.00% |
401,961 |
155,673 |
0 |
0 |
 | | 1992 |
585,929 |
1 |
2 |
0 |
241,809 |
41.27% |
70.63% |
29.37% |
0.00% |
0.00% |
413,869 |
172,060 |
0 |
0 |
 | | 1988 |
583,419 |
2 |
1 |
0 |
22,243 |
3.81% |
48.09% |
51.91% |
0.00% |
0.00% |
280,588 |
302,831 |
0 |
0 |
 | | 1984 |
664,047 |
1 |
2 |
0 |
231,847 |
34.91% |
67.46% |
32.54% |
0.00% |
0.00% |
447,947 |
216,100 |
0 |
0 |
|
