State Auditor General Election Results Comparison - West Virginia
| Map | Pie | Year | Total | D | R | I | Margin | %Margin | Dem | Rep | Ind | Oth. | Dem | Rep | Ind | Other |
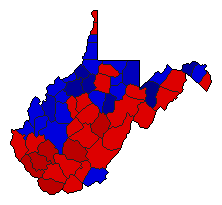
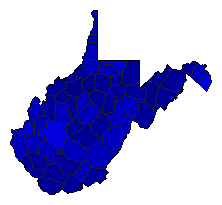 |  | 2020 | 741,272 | 2 | 1 | 0 | 252,418 | 34.05% | 32.97% | 67.03% | 0.00% | 0.00% | 244,427 | 496,845 | 0 | 0 |
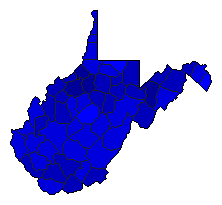 |  | 2016 | 659,740 | 2 | 1 | 0 | 157,830 | 23.92% | 34.56% | 58.48% | 0.00% | 6.96% | 228,001 | 385,831 | 0 | 45,908 |
 | 2012 | 619,569 | 1 | 2 | 0 | 91,651 | 14.79% | 57.40% | 42.60% | 0.00% | 0.00% | 355,610 | 263,959 | 0 | 0 | |
 | 2004 | 695,821 | 1 | 2 | 0 | 160,533 | 23.07% | 61.54% | 38.46% | 0.00% | 0.00% | 428,177 | 267,644 | 0 | 0 | |
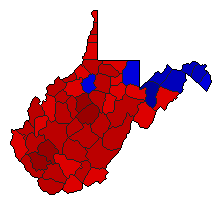
 | 1988 | 575,657 | 1 | 2 | 0 | 177,033 | 30.75% | 65.38% | 34.62% | 0.00% | 0.00% | 376,345 | 199,312 | 0 | 0 | |
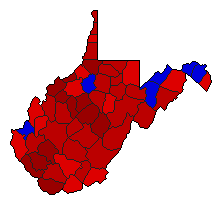
 | 1984 | 657,886 | 1 | 2 | 0 | 229,060 | 34.82% | 67.41% | 32.59% | 0.00% | 0.00% | 443,473 | 214,413 | 0 | 0 | |
 |  | 1952 | 786,023 | 1 | 2 | 0 | 18,373 | 2.34% | 51.17% | 48.83% | 0.00% | 0.00% | 402,198 | 383,825 | 0 | 0 |
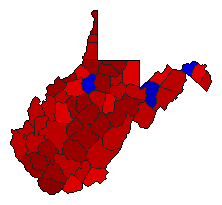
West Virginia Results for 1988
Login
© Dave Leip's Atlas of U.S. Elections, LLC 2019 All Rights Reserved
Note: The advertisement links below may advocate political positions that this site does not endorse.
Login
© Dave Leip's Atlas of U.S. Elections, LLC 2019 All Rights Reserved
Note: The advertisement links below may advocate political positions that this site does not endorse.