1988 General Election Results Comparison - West Virginia
| Map | Pie | Office | Total | D | R | I | Margin | %Margin | Dem | Rep | Ind | Oth. | Dem | Rep | Ind | Other |
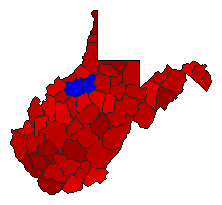
 |  | President | 653,311 | 1 | 2 | - | 30,951 | 4.74% | 52.20% | 47.46% | 0.00% | 0.34% | 341,016 | 310,065 | 0 | 2,230 |
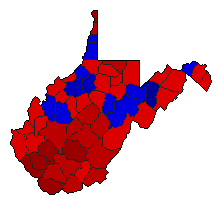
 | Senator | 634,547 | 1 | 2 | 0 | 187,419 | 29.54% | 64.77% | 35.23% | 0.00% | 0.00% | 410,983 | 223,564 | 0 | 0 | |
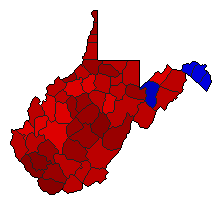
 | Governor | 649,593 | 1 | 2 | 0 | 115,249 | 17.74% | 58.87% | 41.13% | 0.00% | 0.00% | 382,421 | 267,172 | 0 | 0 | |
 | State Auditor | 575,657 | 1 | 2 | 0 | 177,033 | 30.75% | 65.38% | 34.62% | 0.00% | 0.00% | 376,345 | 199,312 | 0 | 0 | |
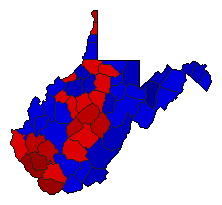 | Agriculture Commissioner | 583,419 | 2 | 1 | 0 | 22,243 | 3.81% | 48.09% | 51.91% | 0.00% | 0.00% | 280,588 | 302,831 | 0 | 0 |
West Virginia Results for 1988
Login
© Dave Leip's Atlas of U.S. Elections, LLC 2019 All Rights Reserved
Note: The advertisement links below may advocate political positions that this site does not endorse.
Login
© Dave Leip's Atlas of U.S. Elections, LLC 2019 All Rights Reserved
Note: The advertisement links below may advocate political positions that this site does not endorse.