1988 General Election Results Comparison - California
| Map | Pie | Office | Total | D | R | I | Margin | %Margin | Dem | Rep | Ind | Oth. | Dem | Rep | Ind | Other |
 |  | President | 9,887,064 | 2 | 1 | - | 352,684 | 3.57% | 47.56% | 51.13% | 0.00% | 1.31% | 4,702,233 | 5,054,917 | 0 | 129,914 |
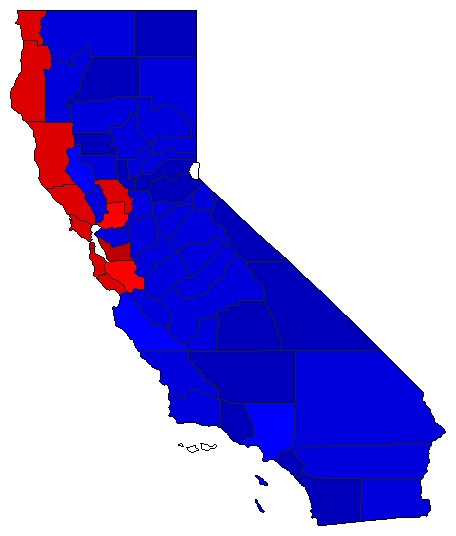 | Senator | 9,743,529 | 2 | 1 | 0 | 856,159 | 8.79% | 44.00% | 52.79% | 0.00% | 3.21% | 4,287,241 | 5,143,400 | 0 | 312,888 | |
| Map | Pie | Initiative | Total Vote | N | Y | Margin | %Margin | No | Yes | Oth. | No | Yes | ||||
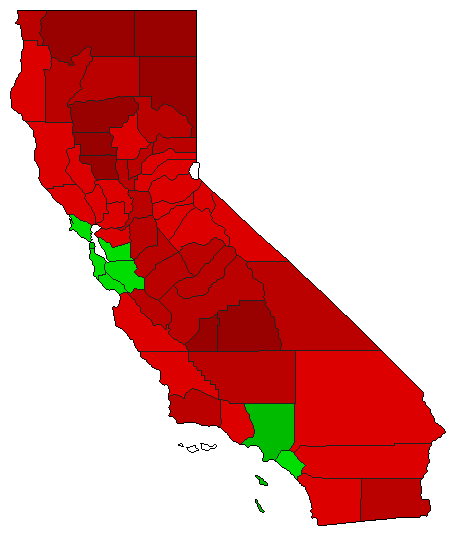 |  | Initiative | 9,475,064 | 2 | 0 | 1 | 213,560 | 2.25% | 48.87% | 0.00% | 51.13% | 0.00% | 4,630,752 | 0 | 4,844,312 | 0 |
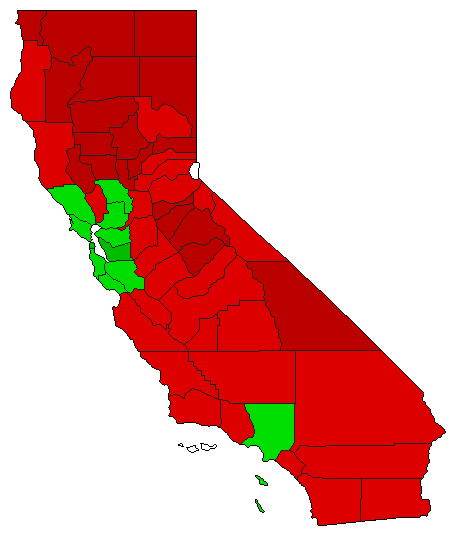 |  | Initiative | 9,129,240 | 2 | 0 | 1 | 128,234 | 1.40% | 49.30% | 0.00% | 50.70% | 0.00% | 4,500,503 | 0 | 4,628,737 | 0 |
California Results for 1988
Login
© Dave Leip's Atlas of U.S. Elections, LLC 2019 All Rights Reserved
Note: The advertisement links below may advocate political positions that this site does not endorse.
Login
© Dave Leip's Atlas of U.S. Elections, LLC 2019 All Rights Reserved
Note: The advertisement links below may advocate political positions that this site does not endorse.