Note: The Google advertisement links below may advocate political positions that this site does not endorse.
| Map | Pie | Office | Total | D | R | I | Margin | %Margin | Dem | Rep | Ind | Oth. | Dem | Rep | Ind | Other | | | | | | | | | | | | | | | | | | |
|---|
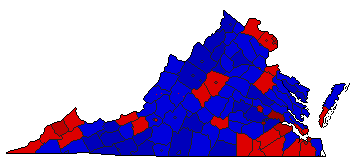 | | Governor |
1,789,371 |
1 |
2 |
0 |
6,854 |
0.38% |
50.14% |
49.75% |
0.00% |
0.11% |
897,139 |
890,285 |
0 |
1,947 |
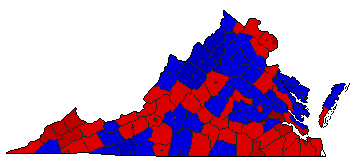 |  | Lt. Governor |
1,726,274 |
1 |
2 |
0 |
143,017 |
8.28% |
54.13% |
45.84% |
0.00% |
0.03% |
934,377 |
791,360 |
0 |
537 |
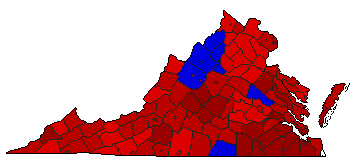 | | Attorney General |
1,734,529 |
1 |
2 |
0 |
457,971 |
26.40% |
63.19% |
36.79% |
0.00% |
0.02% |
1,096,095 |
638,124 |
0 |
310 |
|
