| Map | Pie | Office | Total | D | R | I | Margin | %Margin | Dem | Rep | Ind | Oth. | Dem | Rep | Ind | Other | | | | | | | | | | | | | | | | | | |
|---|
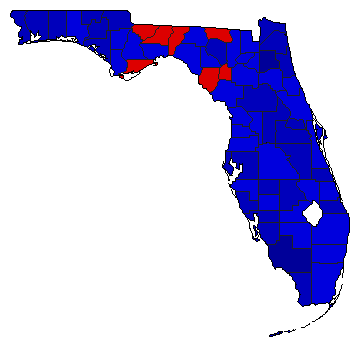
 |  | Governor |
3,530,871 |
1 |
2 |
0 |
460,138 |
13.03% |
56.51% |
43.48% |
0.00% |
0.02% |
1,995,206 |
1,535,068 |
0 |
597 |
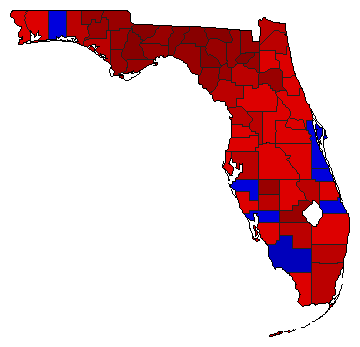
 | | Secretary of State |
3,419,669 |
2 |
1 |
0 |
642,059 |
18.78% |
40.61% |
59.38% |
0.00% |
0.01% |
1,388,600 |
2,030,659 |
0 |
410 |
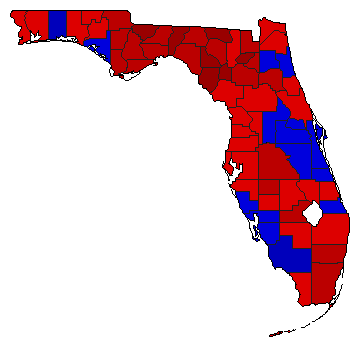
 | | State Treasurer |
3,434,757 |
2 |
1 |
0 |
495,675 |
14.43% |
42.78% |
57.22% |
0.00% |
0.00% |
1,469,541 |
1,965,216 |
0 |
0 |
 | | Comptroller General |
3,357,277 |
1 |
2 |
0 |
641,139 |
19.10% |
59.55% |
40.45% |
0.00% |
0.00% |
1,999,208 |
1,358,069 |
0 |
0 |
 |  | Agriculture Commissioner |
3,370,443 |
1 |
2 |
3 |
365,244 |
10.84% |
55.41% |
44.57% |
0.02% |
0.00% |
1,867,568 |
1,502,324 |
551 |
0 |
| | | Map | Pie | Initiative | Total Vote | N | | Y | Margin | %Margin | No | | Yes | Oth. | No | | Yes | |
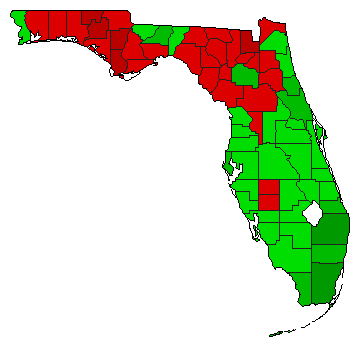 | | Referendum |
3,069,837 |
2 |
0 |
1 |
586,917 |
19.12% |
40.44% |
0.00% |
59.56% |
0.00% |
1,241,460 |
0 |
1,828,377 |
0 |
|
