| Map | Pie | Office | Total | D | R | I | Margin | %Margin | Dem | Rep | Ind | Oth. | Dem | Rep | Ind | Other | | | | | | | | | | | | | | | | | | |
|---|
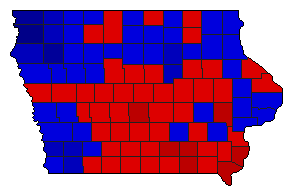
 |  | Senator |
983,933 |
1 |
2 |
0 |
76,298 |
7.75% |
53.82% |
46.07% |
0.00% |
0.11% |
529,571 |
453,273 |
0 |
1,089 |
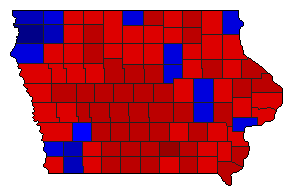
 |  | Governor |
976,483 |
2 |
1 |
0 |
212,480 |
21.76% |
38.85% |
60.61% |
0.00% |
0.54% |
379,372 |
591,852 |
0 |
5,259 |
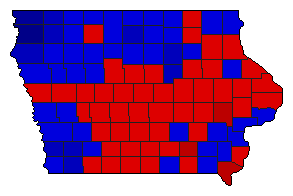
 | | Secretary of State |
902,422 |
1 |
2 |
0 |
41,726 |
4.62% |
52.29% |
47.67% |
0.00% |
0.04% |
471,888 |
430,162 |
0 |
372 |
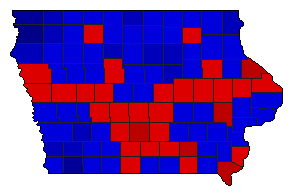
 | | State Treasurer |
894,714 |
1 |
2 |
0 |
172,981 |
19.33% |
58.78% |
39.44% |
0.00% |
1.78% |
525,874 |
352,893 |
0 |
15,947 |
 |  | Attorney General |
914,857 |
1 |
2 |
0 |
38,833 |
4.24% |
52.08% |
47.84% |
0.00% |
0.08% |
476,477 |
437,644 |
0 |
736 |
 | | State Auditor |
889,964 |
2 |
1 |
0 |
8,100 |
0.91% |
49.53% |
50.44% |
0.00% |
0.03% |
440,798 |
448,898 |
0 |
268 |
 |  | Agriculture Commissioner |
895,512 |
1 |
2 |
3 |
140,998 |
15.74% |
56.96% |
41.21% |
1.80% |
0.02% |
510,082 |
369,084 |
16,138 |
208 |
|
